
Momentum Oscillator
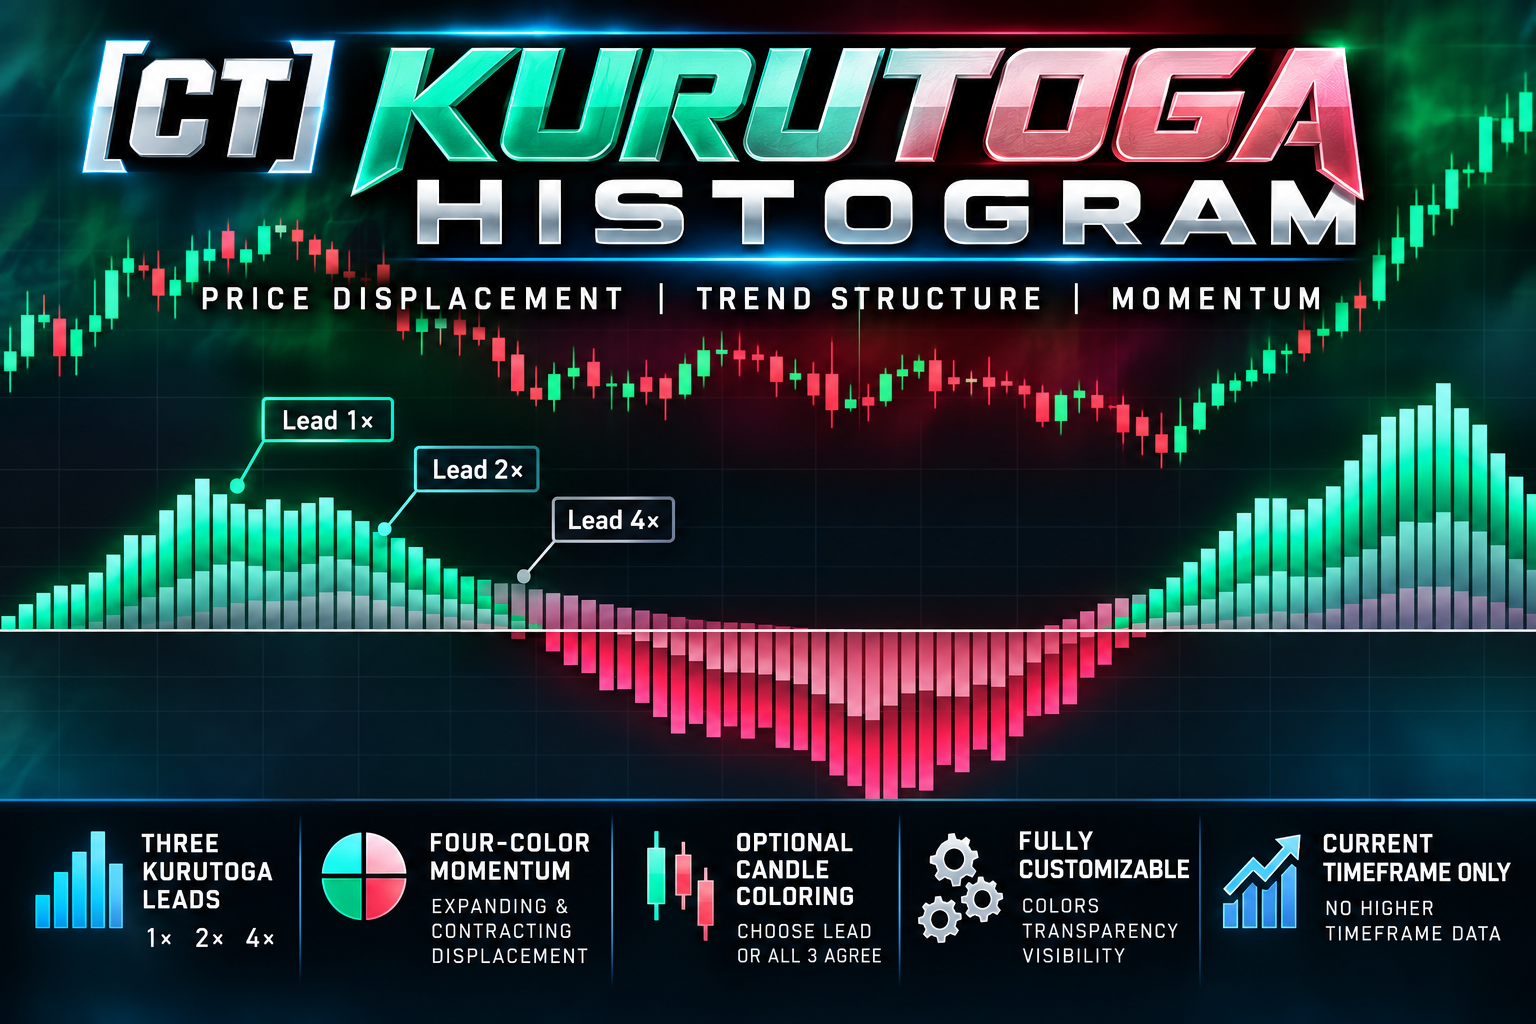
[CT] Kurutoga Histogram
The [CT] Kurutoga Histogram is a three-layer price displacement and trend analysis indicator that measures the distance between closing price and the midpoint of multiple historical high/low ranges. Featuring three customizable histogram leads, four-color momentum visualization, and optional directional candle coloring, this indicator helps traders identify trend alignment, strengthening and weakening price movement, pullbacks, and potential market reversals.