
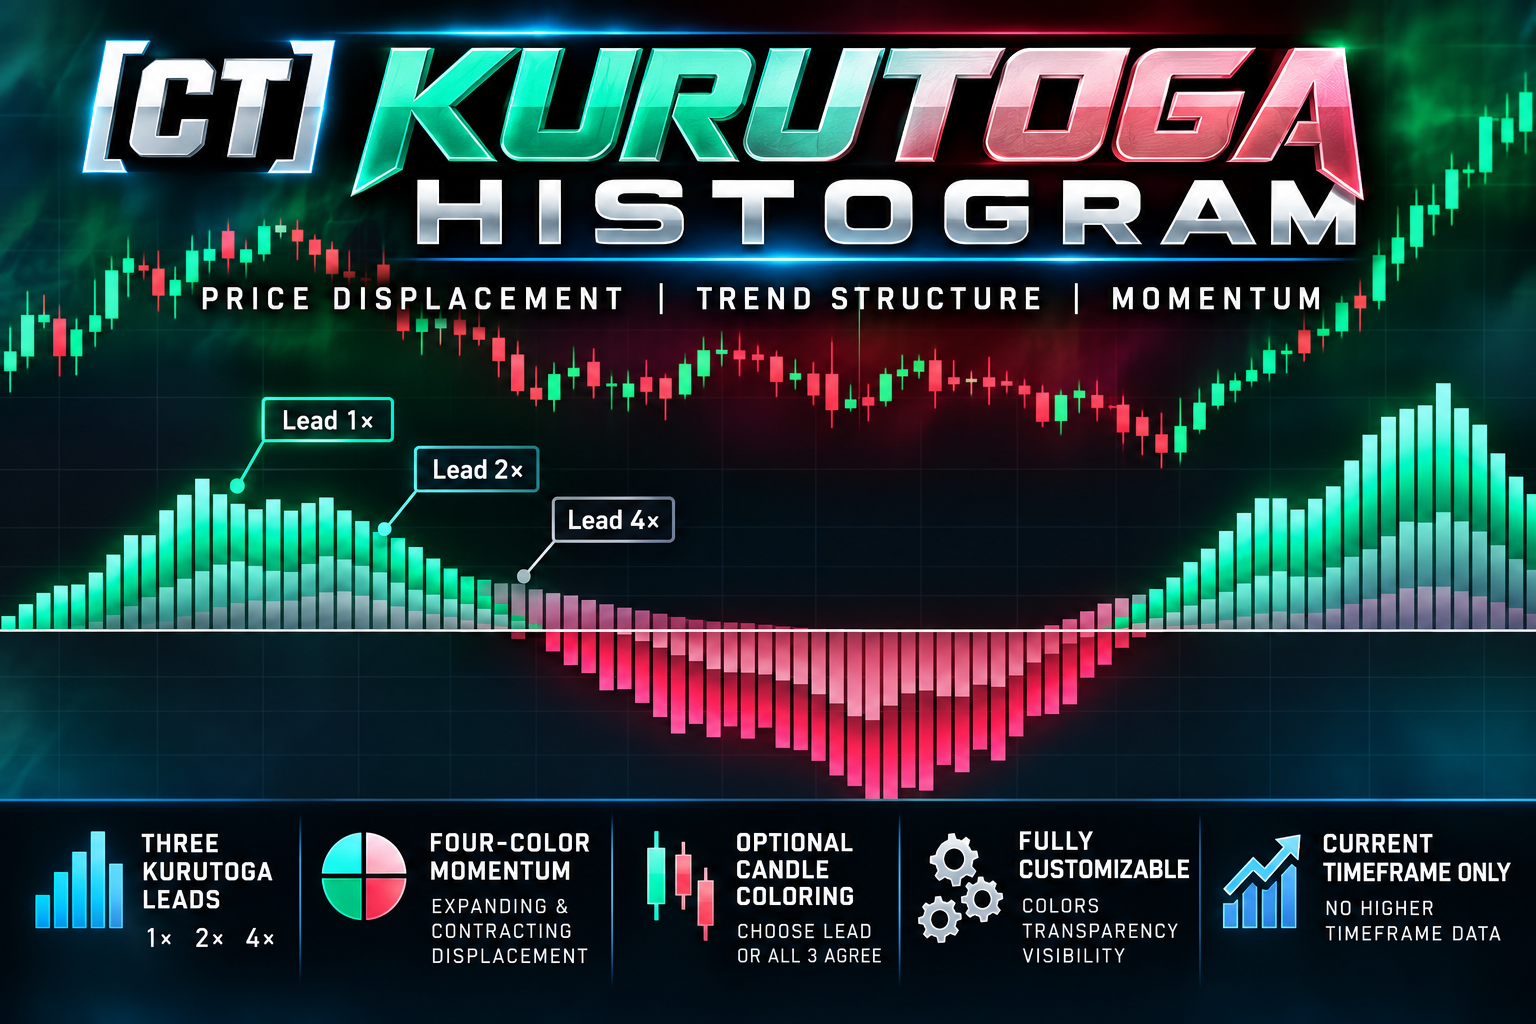
About [CT] Kurutoga Histogram
The [CT] Kurutoga Histogram is a technical analysis indicator designed to help traders evaluate market direction, price displacement, and changes in directional pressure through a three-layer histogram system. Unlike traditional momentum indicators that rely primarily on moving averages, the Kurutoga Histogram measures how far the current closing price is positioned above or below the midpoint of a defined historical high/low range. The indicator uses three separate lookback periods to provide short-term, intermediate-term, and broader price structure analysis. **Three Kurutoga Leads** - Lead 1× measures price displacement using the selected Base Length. - Lead 2× measures displacement using twice the Base Length. - Lead 4× measures displacement using four times the Base Length. Each lead calculates its own highest high, lowest low, and range midpoint, allowing traders to compare price positioning across three different historical ranges. **Four-Color Momentum System** The histogram uses four distinct colors to identify whether bullish or bearish price displacement is expanding or contracting. This helps traders recognize potential momentum shifts, weakening trends, pullbacks, and developing directional changes. **Optional Price Candle Coloring** The indicator can automatically color price candles using the directional state of Lead 1×, Lead 2×, Lead 4×, or agreement between all three leads. When All 3 Must Agree is selected, candles display bullish colors when all three leads are positive, bearish colors when all three are negative, and a neutral color when their directional readings disagree. **Customizable Display** Each histogram lead can be independently enabled or disabled. Traders can also customize histogram colors, transparency, and candle coloring. All calculations use the active chart timeframe, ensuring that the indicator updates automatically when the chart timeframe changes. The [CT] Kurutoga Histogram provides a structured visual framework for evaluating trend direction, identifying potential continuation opportunities, and understanding how price movement develops relative to multiple high/low price ranges.
What this indicator provides
- Three-Layer Price Displacement Histogram
- 1×, 2×, and 4× Lookback Analysis
- Four-Color Momentum Progression
- Expanding and Contracting Price Displacement
- Automatic Bullish and Bearish Candle Coloring
- All Three Leads Must Agree Option
- Short-Term and Broader Trend Alignment
- Dynamic High/Low Range Midpoint Calculations
- Solid Histogram Columns
- Individual Lead Visibility Controls
- Customizable Histogram Transparency
- Adjustable Color Schemes
- Zero-Line Directional Analysis
- Current Timeframe Only
- Trend Continuation and Pullback Identification
How It Works
The [CT] Kurutoga Histogram calculates price displacement from the midpoint of three historical high/low ranges. **Step 1: Calculate the Price Range** For each lead, the indicator identifies: - Highest High: Highest candle high over the selected lookback. - Lowest Low: Lowest candle low over the selected lookback. - Midpoint: (Highest High + Lowest Low) ÷ 2. **Step 2: Calculate Price Displacement** Kurutoga Value = Current Close − Range Midpoint Positive readings indicate that price is above the calculated midpoint. Negative readings indicate that price is below it. **Step 3: Calculate Three Histogram Leads** Using the default Base Length of 14: - Lead 1×: 14 candles. - Lead 2×: 28 candles. - Lead 4×: 56 candles. All three calculations use the current chart timeframe. **Step 4: Apply Four-Color Momentum Logic** The histogram compares each lead's current reading with its previous reading. - Light Green: Positive displacement increasing. - Dark Green: Positive displacement decreasing. - Light Pink: Negative displacement becoming more negative. - Dark Pink: Negative displacement becoming less negative. The darker bearish shade also serves as the fallback color for unchanged or otherwise unmatched conditions. **Step 5: Evaluate Directional Agreement** When all three leads are above zero, price is positioned above all three calculated midpoints. When all three leads are below zero, price is positioned below all three midpoints. When the leads disagree, price may be experiencing a pullback, consolidation, or directional transition. **Step 6: Apply Optional Candle Coloring** Traders can choose which lead controls price candle colors. Available modes: - Lead 1× - Lead 2× - Lead 4× - All 3 Must Agree In agreement mode, mixed directional readings produce neutral-colored candles. When all three agree, Lead 1× determines the light or dark shade. **Zero Line** The horizontal zero line provides the primary reference for distinguishing positive and negative price displacement. The histogram measures price distance from a moving range midpoint rather than volume, order flow, or independently calculated momentum acceleration.
Suggested Usage
The [CT] Kurutoga Histogram can be used as a directional trend filter, price displacement indicator, and confirmation tool alongside price action and market structure analysis. **Bullish Trend Alignment** Look for all three Kurutoga leads above zero. This indicates that price is positioned above the midpoint of the short-term, intermediate-term, and broader historical ranges. When Lead 1× displays expanding positive displacement, traders can monitor for potential bullish continuation opportunities. **Bearish Trend Alignment** Look for all three leads below zero. This indicates that price is positioned below the midpoint of all three historical ranges. Expanding negative displacement on Lead 1× may provide additional evidence of downward directional pressure. **Pullback Trading** During bullish conditions, Lead 1× may begin weakening while Leads 2× and 4× remain positive. This can indicate a temporary pullback within broader bullish positioning. Traders may wait for Lead 1× to strengthen again while confirming the setup with bullish price action. The opposite principle applies during bearish conditions. **Early Directional Changes** Lead 1× will often respond to changing price conditions before the longer-lookback leads. When Lead 1× crosses zero while Leads 2× and 4× remain on the opposite side, traders can monitor for a potential developing reversal or temporary retracement. Additional agreement among the leads may strengthen the directional evidence. **Three-Lead Candle Confirmation** For traders who prefer clear directional filtering, select All 3 Must Agree under Candle Coloring. - Bullish colors: All three leads above zero. - Bearish colors: All three leads below zero. - Neutral colors: Mixed conditions. This can help traders avoid some situations where short-term and broader price positioning disagree. **Combining with Price Action** The indicator can complement: - Fractal highs and lows. - Market structure breaks. - Support and resistance levels.
Settings and Configuration
The [CT] Kurutoga Histogram provides customizable settings for lookback periods, histogram visibility, color schemes, transparency, and price candle coloring. **Core Settings** Base Length: Default 14. The selected Base Length determines all three histogram calculations: - Lead 1× = Base Length. - Lead 2× = Base Length × 2. - Lead 4× = Base Length × 4. Shorter Base Length settings generally produce more responsive readings, while longer settings reflect broader historical price ranges. **Histogram Visibility** Each histogram lead can be independently shown or hidden. - Show Kurutoga Lead. - Show Kurutoga Lead 2×. - Show Kurutoga Lead 4×. **Four-Color Histogram Settings** Default colors: - Up Light: RGB (180, 255, 230). - Up Dark: RGB (90, 210, 190). - Down Light: RGB (255, 190, 200). - Down Dark: RGB (210, 100, 130). All colors can be customized. **Histogram Transparency** - Lead 1×: Default 0%. - Lead 2×: Default 35%. - Lead 4×: Default 70%. Independent transparency settings help distinguish the three overlapping histogram plots. **Price Candle Coloring** Color Price Candles: Enabled by default. Candle Color Based On: - Lead 1× (default). - Lead 2×. - Lead 4×. - All 3 Must Agree. Neutral Candle Color: Gray by default. Candle colors use the selected lead's four-color logic at full opacity, independently of histogram transparency. **Display** - Solid
This tool is designed to support a complete trading process with market context, defined risk, and clear invalidation. It is not a guarantee of future results.