
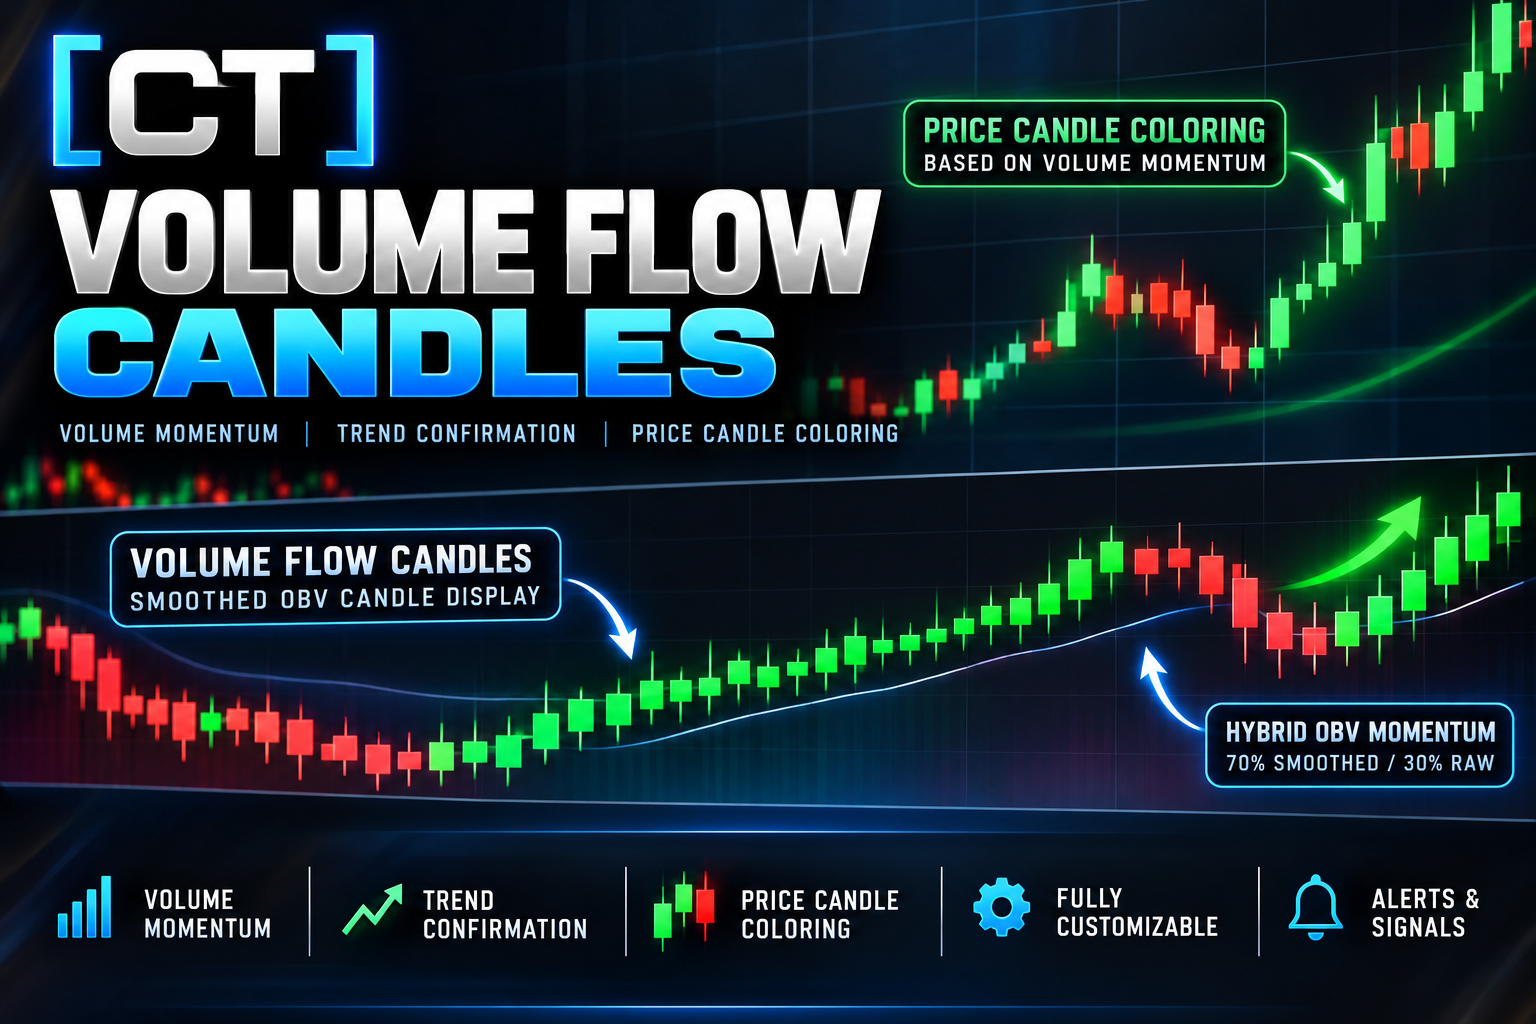
About [CT] Volume Flow Candles
[CT] Volume Flow Candles is an advanced volume-based indicator that transforms traditional On-Balance Volume (OBV) into an intuitive candlestick display, helping traders evaluate volume momentum, trend strength, and potential changes in market direction. Unlike conventional price candles, which show price movement, Volume Flow Candles illustrate changes in cumulative volume flow. This allows traders to assess whether volume momentum is supporting a trend, weakening during a pullback, or beginning to shift ahead of a potential price reversal. The indicator combines DEMA smoothing with a customizable Hybrid OBV Momentum engine that blends smoothed and raw volume movement. Its unique candle-coloring feature also applies volume-based bullish and bearish colors directly to the main price chart, allowing traders to recognize agreement or disagreement between price action and volume momentum. Enhanced candle visibility, adjustable moving averages, customizable colors, and alerts make this indicator a versatile tool for intraday trading, trend following, and market-structure analysis.
What this indicator provides
- - Hybrid OBV Momentum (70% Smoothed / 30% Raw)
- - Automatic Price Candle Coloring
- - Bullish & Bearish Volume Confirmation
- - Early Momentum Shift Detection
- - DEMA-Smoothed Volume Candles
- - Enhanced Candle Visibility
- - Trend & Pullback Confirmation
- - Customizable Moving Averages
- - Bullish & Bearish Alerts
- - Market Structure & ABS Entry Alignment
How It Works
[CT] Volume Flow Candles calculates On-Balance Volume (OBV) by adding volume when price closes higher and subtracting volume when price closes lower. These cumulative values are transformed into synthetic volume-based candlesticks. **Hybrid OBV Momentum:** By default, the indicator combines 70% smoothed OBV momentum with 30% raw OBV momentum. This balances trend filtering with sensitivity to shorter-term volume changes. **Green Candles:** Indicate positive volume momentum according to the selected coloring method, suggesting improving bullish volume conditions. **Red Candles:** Indicate negative volume momentum, suggesting weakening bullish conditions or increasing bearish volume pressure. **Price Candle Coloring:** Optionally colors the main chart's price candles using the same volume-momentum signals, making differences between price direction and volume momentum easier to identify. **Smoothing:** Uses DEMA with a default length of 8. Alternative smoothing methods are available to adjust responsiveness. **Enhanced Candle Visibility:** Adjustable body multipliers and minimum body sizes make smaller volume movements easier to see without changing the underlying calculations. **Moving Averages:** Three optional volume-based moving averages provide additional directional analysis and crossover signals. **Alerts:** Bullish and bearish volume-momentum changes and moving-average crossovers can trigger configurable TradingView alerts. Because hybrid coloring can operate independently of the candle body's direction, traders should interpret candle colors as volume-momentum signals rather than traditional price candle direction.
Suggested Usage
[CT] Volume Flow Candles is designed to complement the Traders Vibe market-structure and momentum-based trading process. **1. Establish Market Direction:** Begin by identifying bullish or bearish market structure using the Dual MTF Trend Structure indicator, BOS/CHoCH levels, and relevant support or resistance zones. **2. Confirm Volume Momentum:** Look for green Volume Flow Candles during bullish conditions and red candles during bearish conditions. Sustained directional alignment provides additional confirmation of the prevailing market movement. **3. Identify Momentum Shifts:** Watch for opposing volume candle colors during pullbacks. For example, green volume candles emerging during a bearish move may indicate improving volume momentum, while red candles during an advance may suggest weakening bullish momentum. **4. Evaluate Pullback Entries:** During an established trend, allow price to retrace toward a market-structure zone. Watch for volume momentum to realign with the prevailing trend before evaluating an entry. **5. Confirm Trade Entries:** Combine the indicator with the Traders Vibe ABS entry indicator, Chaos Momentum Indicator (CMI), and Dual MTF Trend Structure Histogram. Seek agreement between market structure, directional momentum, volume flow, and price-action triggers. **6. Manage Trade Risk:** Use structural invalidation levels, appropriate stop placement, and defined risk management. Do not enter trades based solely on a volume candle changing color. For NQ and MNQ intraday trading, the indicator can help distinguish stronger directional opportunities from periods of conflicting or weakening momentum. The indicator is best used as a volume-confirmation and momentum-analysis tool rather than a standalone entry system.
Settings and Configuration
**Recommended Default Settings** - Calculation Mode: Smoothed OBV First - Wick Construction: Price-Proportional Wicks - Enable Smoothing: Yes - Smoother Length: 8 - Smoothing Method: DEMA - Candle Color Logic: Hybrid OBV Direction - Hybrid Smoothed Weight: 70% - Raw OBV Weight: 30% (automatically calculated) - Force Colors to Match Candle Bodies: Disabled - Main Price Candle Coloring: Enabled - Confirm Price Colors on Candle Close: Disabled - Visual Candle Body Size: 1.75 - Minimum Body Strength: 50% - Average Body Lookback: 20 - Moving Averages: Disabled - MA Type: DEMA - MA Lengths: 8, 21, and 1 - MA Crossover Shapes: Disabled - Confirm Alert Signals on Candle Close: Enabled **Configuration Recommendations** **Smoothing:** DEMA 8 provides the default balance between responsiveness and noise reduction. Shorter lengths generally respond faster but may generate more frequent directional changes. **Hybrid Weight:** The default 70/30 blend combines smoothed and raw OBV momentum. Increase the smoothed percentage for greater emphasis on filtered momentum or decrease it to give raw volume changes more influence. **Price Candle Coloring:** Enable this feature to display volume-momentum direction directly on price candles. Disable it when another indicator controls the chart's candle colors. **Candle Visibility:** The 1.75 body multiplier and 50% minimum body strength improve the visibility of small volume candles. These settings affect appearance only, not the underlying volume calculations. **Moving Averages:** Enable optional DEMA moving averages to evaluate volume trends and crossovers. **Timeframes:** Suitable for experimentation on 1-minute, 3-minute, 5-minute, 15-minute, and higher-timeframe charts where reliable volume data is available. **TradingView Alerts:** Configure bullish/bearish volume changes or MA crossovers. Candle-close confirmation is recommended for traders who want to avoid intrabar alert changes. These defaults are starting settings, not statistically optimized parameters. Test them on your instrument and timeframe before incorporating them into a live trading strategy.
This tool is designed to support a complete trading process with market context, defined risk, and clear invalidation. It is not a guarantee of future results.