
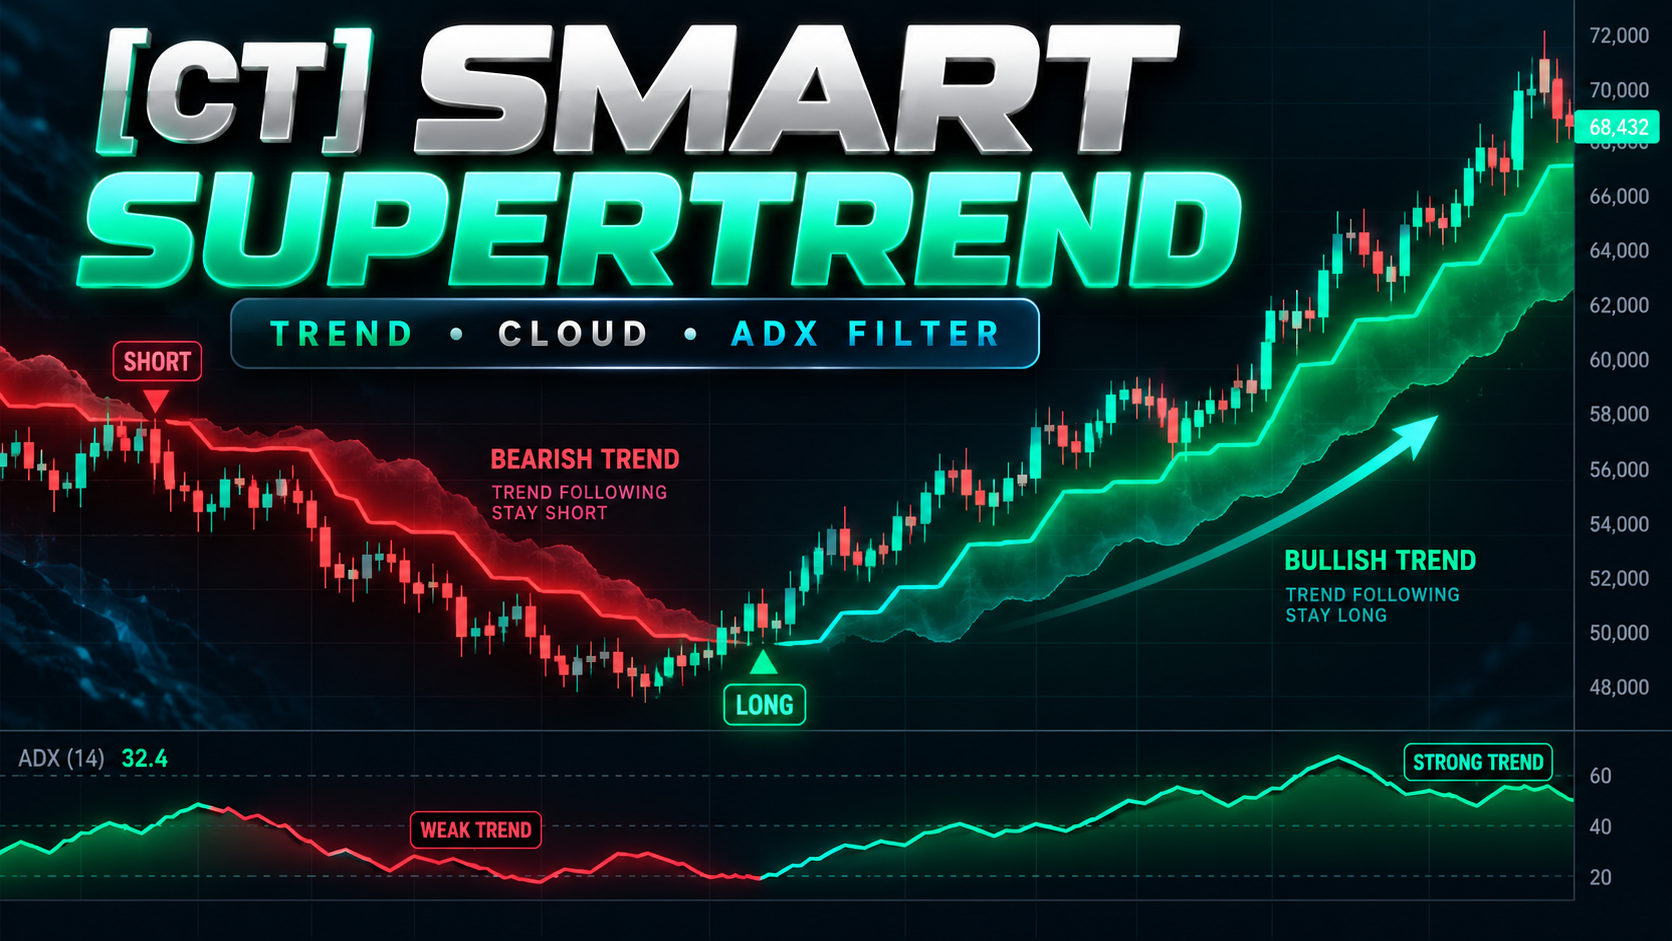
About [CT] Smart Supertrend
The [CT] Smart Supertrend is a multi-component technical analysis indicator designed to help traders identify market trends, evaluate directional conditions, and recognize potential trend reversals. Unlike a traditional SuperTrend indicator that relies primarily on volatility and price movement, Smart Supertrend combines several analytical methods into a unified trend-following system. **Pivot-Based SuperTrend** The indicator uses confirmed price pivots and Average True Range (ATR) calculations to establish a dynamic trailing trend line. This line adjusts as market conditions change and provides a visual reference for the prevailing trend. **Adaptive MAMA/FAMA Cloud** An adaptive cloud is constructed using the MESA Adaptive Moving Average (MAMA) and Following Adaptive Moving Average (FAMA). These calculations adjust their responsiveness to changing market conditions, creating a dynamic view of price behavior. The cloud changes color based on the direction of an adaptive KAMA calculation, helping traders distinguish bullish and bearish market conditions. **ADX Trend Strength Filtering** The Average Directional Index (ADX), together with positive and negative directional movement, is used internally to evaluate trend strength and directional agreement. **Trading Signals** Optional bullish and bearish markers identify qualifying SuperTrend direction changes. Additional signal logic incorporates cloud direction and ADX conditions. **Customizable Display** Traders can enable or disable signal markers and candle coloring while adjusting cloud appearance, ATR sensitivity, pivot detection, and ADX parameters. The primary objective of [CT] Smart Supertrend is to provide traders with a structured method for analyzing directional price movement, recognizing potential trend transitions, and evaluating whether market conditions favor trend-following strategies.
What this indicator provides
- Pivot-Based SuperTrend Analysis
- Adaptive MAMA/FAMA Trend Cloud
- KAMA-Based Bullish and Bearish Cloud Colors
- Dynamic ATR Trailing Trend Line
- Internal ADX Trend Strength Filtering
- Optional Long and Short Signal Markers
- Potential Trend Reversal Identification
- Optional Price Candle Coloring
- Customizable Trend Sensitivity
- Adjustable Cloud Colors and Transparency
- Trend Continuation and Pullback Analysis
- Compatible with Stocks, Futures, Forex, and Crypto
How It Works
The [CT] Smart Supertrend combines four technical analysis components to evaluate market direction and trend conditions. **1. Pivot-Based SuperTrend** The indicator identifies price pivot highs and lows to calculate a smoothed pivot center. An ATR multiplier is applied above and below this reference to establish dynamic trailing levels. - Bullish Trend: Price satisfies the indicator's upward trend conditions. - Bearish Trend: Price satisfies the indicator's downward trend conditions. - PP Line: Displays the active pivot-based ATR trailing level. **2. Adaptive Trend Cloud** Two adaptive moving averages, MAMA and FAMA, form the visual cloud. The cloud's direction is determined by whether the internal KAMA calculation is rising or falling. - Teal/Green Cloud: KAMA is rising, indicating bullish directional conditions. - Red Cloud: KAMA is falling, indicating bearish directional conditions. - Neutral Color: Used when no new directional cloud state is established. Cloud transparency and colors are fully customizable. **3. ADX Strength Filter** The indicator calculates directional movement and ADX to evaluate trend strength. Bullish directional confirmation requires positive directional movement to exceed negative directional movement while ADX is above the selected threshold. Bearish directional confirmation requires negative directional movement to exceed positive directional movement while ADX is above the selected threshold. ADX is used internally and is not plotted in a separate indicator panel. **4. Optional Signal Markers** - Green Triangle: Potential bullish SuperTrend reversal when the adaptive cloud is not bearish, or when the script's additional bullish confirmation condition is met. - Red Triangle: Potential bearish SuperTrend reversal when the adaptive cloud is not bullish, or when the additional bearish confirmation condition is met. - Green X: An opposing bearish SuperTrend reversal while the cloud remains bullish. - Red X: An opposing bullish SuperTrend reversal while the cloud remains bearish. **5. Optional Candle Coloring** When enabled, price candles are colored according to the adaptive cloud's bullish or bearish direction. The indicator combines price structure, volatility, adaptive trend analysis, and directional movement to help traders evaluate potential trend-following opportunities.
Suggested Usage
The [CT] Smart Supertrend is designed for traders who want to identify developing trends, recognize potential reversals, and avoid trading against the prevailing market direction. **Bullish Trend Opportunities** Look for price trading above the pivot-based SuperTrend trailing line while the adaptive cloud displays bullish coloring. A bullish signal marker may provide additional evidence of a developing upward trend. Monitor price action for pullbacks toward the trailing line or adaptive cloud, where potential trend continuation opportunities may develop. **Bearish Trend Opportunities** Look for price trading below the SuperTrend trailing line while the adaptive cloud displays bearish coloring. A bearish signal marker may indicate a developing downward trend. Watch for price retracements toward the trailing line or cloud as possible areas for bearish continuation analysis. **Trend Continuation** When the SuperTrend direction and adaptive cloud agree, traders can use that alignment as a directional filter. Rather than attempting to predict every market reversal, traders may focus on opportunities that follow the established direction. **Potential Trend Reversals** Changes in the SuperTrend direction, adaptive cloud color, or signal markers can highlight possible market transitions. When the trailing trend line and cloud disagree, additional confirmation may be appropriate. **ADX Confirmation** The internal ADX filter helps evaluate whether directional movement is supported by sufficient trend strength according to the configured threshold. **Combining with Price Action** For additional confirmation, combine Smart Supertrend with: - Fractal swing highs and lows. - Support and resistance. - Market structure breaks. - Breakout and retest patterns. - Momentum or volume analysis. **Risk Management** The trailing line can provide a reference for evaluating potential stop placement or trade invalidation. It should not be assumed to represent an appropriate stop distance for every trade. This indicator works best as part of a complete trading strategy that includes position sizing, risk controls, and clearly defined entry and exit criteria.
Settings and Configuration
The [CT] Smart Supertrend provides adjustable settings for pivot detection, ATR trend sensitivity, adaptive cloud calculations, ADX filtering, and chart appearance. **Core Settings** - Source (Cloud): Default Open. Controls the price source used for adaptive cloud calculations. - PP Period: Default 2. Controls pivot detection sensitivity. - ATR Factor: Default 3.0. Determines the ATR multiplier applied to the pivot-based trailing levels. - ATR Period (PP Line): Default 12. Controls the volatility calculation used for the SuperTrend trailing line. - Cloud Length (ER): Default 12. Determines the lookback used for the adaptive efficiency-ratio calculation. - ADX Length: Default 24. Controls directional movement and trend-strength smoothing. - ADX Threshold: Default 24.0. Establishes the minimum ADX level for internal trend-strength confirmation. **Display Settings** - Show Signals: Disabled by default. - Color Candles: Disabled by default. Enable signal markers to display potential bullish and bearish reversals and opposing-trend warning markers. Enable candle coloring to visually identify the current adaptive cloud direction. **Cloud Styling** - Cloud Fill Transparency: Default 80. - Bullish Cloud Color: Teal (#00E6DA). - Bearish Cloud Color: Red (#FF5252). - Neutral Cloud Color: Gray. **Suggested Starting Settings** For intraday trading, begin with the indicator defaults: - PP Period: 2. - ATR Factor: 3.0. - ATR Period: 12. - Cloud Length: 12. - ADX Length: 24. - ADX Threshold: 24. - Show Signals: Enabled if directional markers are desired. - Color Candles: Optional. **Adjustment Guidelines** A smaller ATR multiplier generally makes the trailing level more sensitive to price changes, while a larger multiplier generally allows more room for price fluctuations. Shorter ATR and pivot settings may produce quicker trend changes but can increase sensitivity to market noise. Higher ADX thresholds generally require stronger measured trend conditions for the internal ADX confirmation. Settings should be evaluated across different instruments and market conditions before use in live trading.
This tool is designed to support a complete trading process with market context, defined risk, and clear invalidation. It is not a guarantee of future results.