
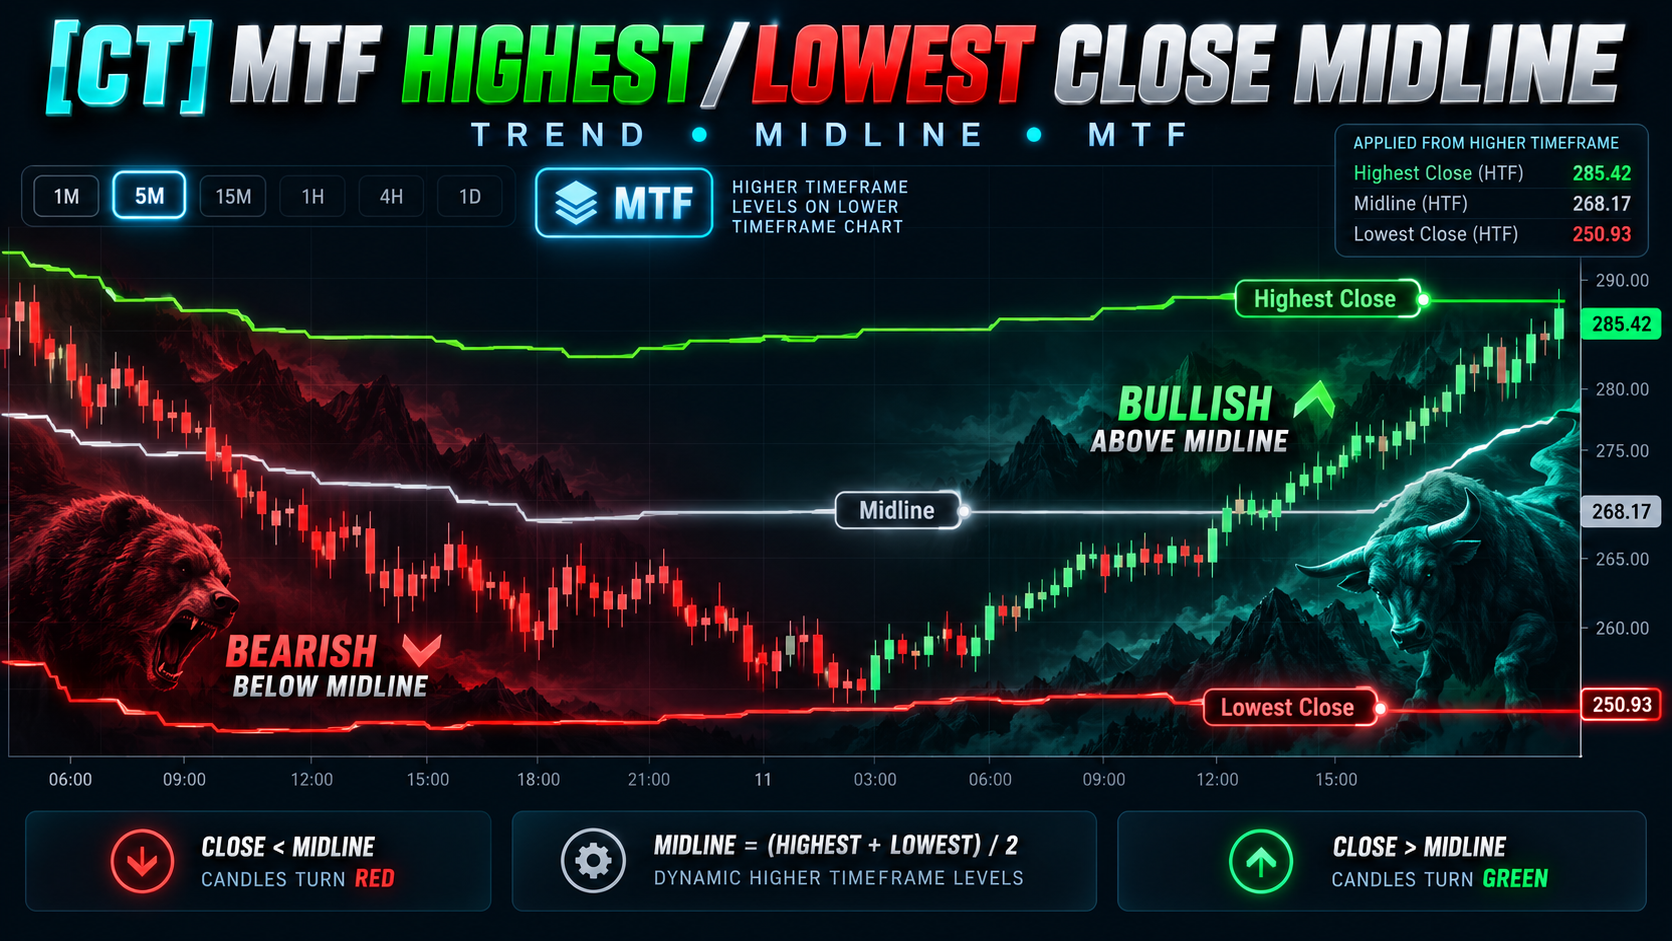
About [CT] MTF Highest/Lowest Close Midline
The [CT] MTF Highest/Lowest Close Midline is a versatile price-action and trend identification indicator designed to help traders understand market direction by analyzing price relative to the midpoint of a selected range. The indicator calculates three important price levels: the highest level, lowest level, and 50% midpoint over a configurable lookback period. Traders can choose between two calculation methods: **Highest/Lowest Close (Original):** Calculates the highest and lowest closing prices within the selected period, providing a closing-price-based view of market structure. **True High/Low (50% Midpoint):** Calculates the highest actual candle high and lowest actual candle low, including wicks, providing a complete representation of the selected price range. The midpoint serves as the primary directional reference. When price closes above the midpoint, candles turn green, indicating bullish positioning. When price closes below the midpoint, candles turn red, indicating bearish positioning. The indicator also features Multi-Timeframe (MTF) functionality, allowing traders to display levels calculated from a selected timeframe directly on their current chart. For example, a trader using a 1-minute chart can display the high, low, and midpoint calculated from 5-minute candles while using the 1-minute closing price to determine directional candle colors. With a lookback period of 1, the True High/Low method displays the actual high, low, and exact 50% midpoint of a single candle from the selected timeframe. This combination of price-level analysis, multi-timeframe calculations, and visual candle coloring makes the indicator useful for identifying directional bias, evaluating pullbacks, recognizing potential trend changes, and confirming price-action trading opportunities.
What this indicator provides
- Multi-Timeframe High, Low, and Midpoint Levels
- Two Selectable Calculation Methods
- Original Highest/Lowest Close Analysis
- True High/Low with 50% Midpoint
- Single-Candle Midpoint Analysis
- Automatic Bullish and Bearish Candle Coloring
- Higher-Timeframe Trend Identification
- Dynamic Price Range Boundaries
- Customizable Lookback Period
- Independent Line Visibility Controls
- Customizable Line and Candle Colors
- Bullish and Bearish Midpoint Crossover Alerts
- Trend Continuation and Pullback Analysis
- Price Action and Market Structure Confirmation
How It Works
The indicator establishes three dynamic price levels using the selected calculation method, lookback period, and timeframe. **Calculation Method 1: Highest/Lowest Close** - High Line: Highest closing price during the selected lookback period. - Low Line: Lowest closing price during the selected lookback period. - Midline: (Highest Close + Lowest Close) ÷ 2. **Calculation Method 2: True High/Low (50% Midpoint)** - High Line: Highest actual candle high during the selected lookback period. - Low Line: Lowest actual candle low during the selected lookback period. - Midline: (Highest High + Lowest Low) ÷ 2. **Single-Candle Analysis** When the lookback period is set to 1, the True High/Low method identifies the actual high, low, and 50% midpoint of a single candle. This allows traders to monitor the equilibrium level of a selected timeframe's candle. **Multi-Timeframe Calculations** When MTF mode is enabled, the indicator calculates its levels using the selected timeframe rather than the chart timeframe. For example, selecting a 5-minute timeframe on a 1-minute chart displays levels derived from 5-minute price activity. **Directional Candle Coloring** - Green: Current chart close is above the selected midpoint. - Red: Current chart close is below the selected midpoint. - Gray: Current chart close equals the midpoint. **Midpoint Crossover Alerts** Bullish alerts trigger when the chart's closing price crosses above the selected midpoint. Bearish alerts trigger when the chart's closing price crosses below the selected midpoint. **Dynamic Price Levels** The high, low, and midpoint levels automatically update as new price data becomes available. Higher-timeframe values may change while their source candle is still forming.
Suggested Usage
The [CT] MTF Highest/Lowest Close Midline can be used as a directional trend filter, dynamic price reference, and multi-timeframe confirmation tool. **Bullish Trend Identification** Look for price consistently closing above the midpoint, accompanied by green candle coloring. A rising midpoint and bullish market structure can provide additional evidence of an advancing market. **Bearish Trend Identification** Look for price consistently closing below the midpoint, accompanied by red candle coloring. A declining midpoint and bearish market structure can provide additional evidence of downward price movement. **Midline Pullback Strategy** During an established uptrend, monitor price retracements toward the midpoint for potential bullish reactions and continuation opportunities. During a downtrend, monitor retracements toward the midpoint for possible bearish rejection and continuation setups. **Single-Candle 50% Strategy** Select True High/Low with a lookback period of 1 to monitor the exact midpoint of the selected timeframe's candle. For example, traders using a 1-minute chart can monitor the 50% level of a 5-minute candle to evaluate whether short-term price is positioned in the upper or lower half of that candle's range. **Multi-Timeframe Trend Filtering** Use a higher-timeframe midpoint to establish directional bias while executing trades on a lower timeframe. For example: - Chart Timeframe: 1 minute. - MTF Timeframe: 5 minutes. - Calculation Method: True High/Low. - Lookback Period: 14. When price remains above the 5-minute midpoint, traders may prioritize bullish setups. When price remains below it, they may prioritize bearish setups. **Midpoint Crossover Strategy** Monitor crossings above or below the midpoint for potential directional changes. Confirm these signals using price action, fractal breaks, market structure, or momentum indicators. **Channel Breakout Analysis** Use the high and low channel boundaries to identify potential expansion beyond the previous closing-price or true-price range. For stronger confirmation, evaluate breakouts relative to the preceding completed channel levels. **Risk Management** Use nearby swing highs, swing lows, and market structure to establish invalidation levels. The indicator's price levels should be treated as analytical references rather than guaranteed support, resistance, or entry signals.
Settings and Configuration
The [CT] MTF Highest/Lowest Close Midline provides customizable settings for calculation methods, multi-timeframe analysis, price-level visibility, and directional candle coloring. **Timeframe Settings** - Use Chart Timeframe: Enabled by default. Calculates the indicator using the current chart timeframe. - MTF Timeframe: Default 5 minutes. Selects an alternative calculation timeframe when chart-timeframe mode is disabled. **Core Settings** Lookback Period: Default 14. Determines how many candles are used to calculate the highest and lowest price levels. Calculation Method: 1. Highest/Lowest Close (Original) — Default. 2. True High/Low (50% Midpoint). **Display Settings** - Show High Line: Enabled by default. - Show Low Line: Enabled by default. - Show Midline: Enabled by default. - Color Price Candles: Enabled by default. Each line can be independently displayed or hidden. **Color Settings** - High Line: Green. - Low Line: Red. - Midline: Gray. - Bullish Candles: Lime Green. - Bearish Candles: Red. - Neutral Candles: Gray. All colors can be customized. **Recommended Starting Configurations** Single-Candle Midpoint Analysis: - Chart: 1 minute. - MTF: 5 minutes. - Lookback: 1. - Calculation: True High/Low. Short-Term Trend Analysis: - Chart: 1 minute. - MTF: 5 minutes. - Lookback: 14. - Calculation: True High/Low. Closing-Price Trend Analysis: - Chart: 5 minutes. - MTF: 15 minutes. - Lookback: 14. - Calculation: Highest/Lowest Close. **Alerts** - Bullish Midline Cross. - Bearish Midline Cross. **Important MTF Note** The current higher-timeframe candle's values may change before that candle closes. Traders should account for developing higher-timeframe levels when interpreting live signals. A period of 1 uses the currently developing selected-timeframe candle, not automatically the previous completed candle.
This tool is designed to support a complete trading process with market context, defined risk, and clear invalidation. It is not a guarantee of future results.