
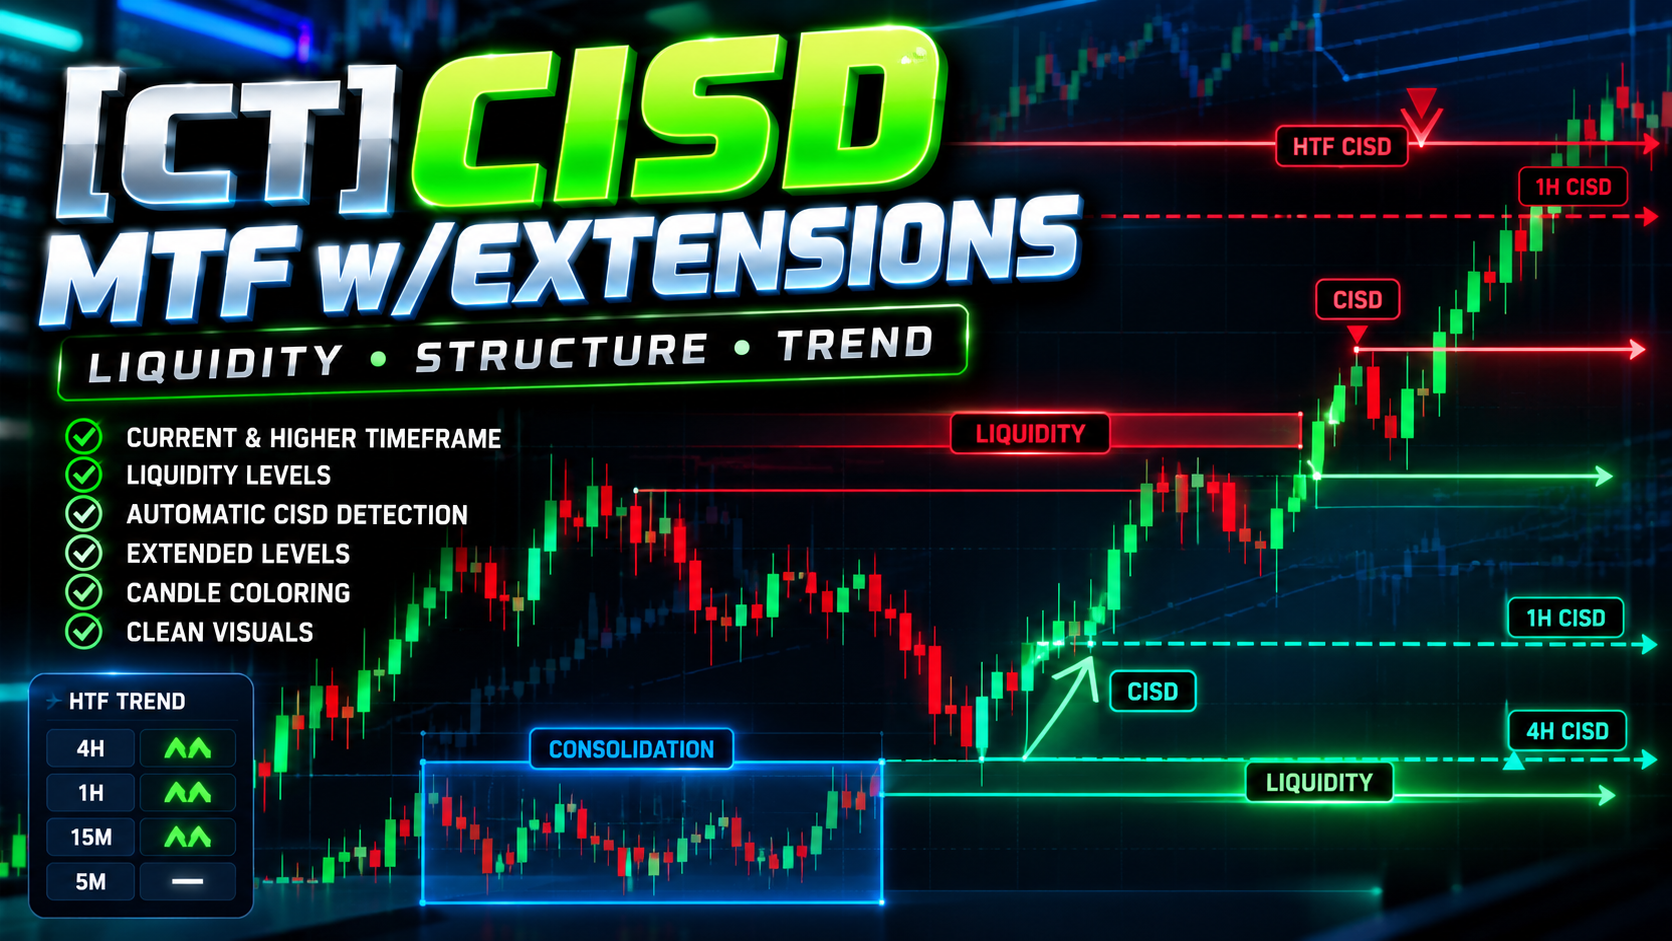
About [CT] MTF CISD w/Extensions
The [CT] MTF CISD w/Extensions is an advanced price action and market structure indicator designed to help traders recognize potential changes in market direction through Change in State of Delivery (CISD) analysis. CISD focuses on shifts in buying and selling pressure by monitoring specific price-action sequences and identifying when price crosses important candle-origin levels. These events can provide early indications that the market's directional behavior may be changing. The indicator automatically detects bullish and bearish CISD events on the current chart timeframe while offering optional higher-timeframe CISD analysis for additional market context. One of its key features is the ability to extend the most recent CISD levels beyond the current candle, making these important price levels easier to monitor as potential areas of support, resistance, or future price interaction. The indicator also incorporates swing high and swing low detection, liquidity-level monitoring, and identification of CISD events that follow recent liquidity sweeps. Customizable bullish and bearish candle coloring provides a visual representation of the most recently detected directional state, with the option to use higher-timeframe direction. By combining current-timeframe market structure with higher-timeframe CISD levels, traders can better evaluate potential market transitions, directional bias, and price-action opportunities. The [CT] MTF CISD w/Extensions indicator is designed for traders who want to incorporate liquidity analysis, market structure, and multiple timeframes into a more organized trading process.
What this indicator provides
- Automatic Bullish and Bearish CISD Detection
- Current and Higher-Timeframe Market Structure
- Extended CISD Support and Resistance Levels
- Liquidity Sweep Identification
- Swing High and Swing Low Detection
- Customizable CISD Noise Filtering
- Directional Candle Coloring
- Optional Higher-Timeframe Trend Coloring
- Confirmed Higher-Timeframe CISD Signals
- Customizable Level Extensions and Labels
- Liquidity Mitigation Monitoring
- CISD and Liquidity Sweep Alerts
- Designed for Price Action and Market Structure Trading
How It Works
The indicator continuously evaluates price action to identify potential bullish and bearish Changes in State of Delivery (CISD). **Bullish CISD** A bullish CISD occurs when price closes above a qualifying candle-origin level identified by the indicator's internal price-action calculations. A green horizontal line marks the detected CISD level, indicating a potential shift toward bullish price delivery. **Bearish CISD** A bearish CISD occurs when price closes below a qualifying candle-origin level. A red horizontal line marks the detected CISD level, indicating a potential shift toward bearish price delivery. **Liquidity Sweep Detection** The indicator monitors swing highs and lows to identify areas where liquidity may exist. When price recently trades through an opposing swing level and a qualifying CISD occurs, the indicator identifies the event as a potential liquidity-sweep confirmation. Green upward markers highlight bullish CISD events associated with recent low-side liquidity sweeps. Red downward markers highlight bearish CISD events associated with recent high-side liquidity sweeps. **Extended CISD Levels** The most recent current-timeframe CISD levels can automatically extend beyond the latest candle. By default, the three most recent levels extend 10 bars to the right. Older CISD levels return to their original endpoints, allowing traders to focus on the most recent structural changes. **Higher-Timeframe CISD** Optional multi-timeframe calculations identify CISD events from a user-selected higher timeframe. Higher-timeframe levels can be displayed as solid or dashed horizontal lines, with customizable labels and optional directional markers. **Candle Coloring** Price candles are colored according to the latest bullish or bearish CISD directional state. Traders can optionally use higher-timeframe CISD direction for candle coloring when higher-timeframe analysis is enabled. **Noise Filtering** A configurable noise filter helps determine which candle-origin levels qualify as CISD events, allowing traders to adjust signal selectivity. The indicator also supports alerts for swing-level mitigation, standard CISD events, liquidity-sweep CISD events, and higher-timeframe CISD signals.
Suggested Usage
The [CT] MTF CISD w/Extensions indicator can be used as a market structure and directional confirmation tool alongside price action, support and resistance, and liquidity analysis. **Bullish Trading Opportunities** Look for price sweeping a previous swing low, followed by a confirmed bullish CISD. A bullish CISD after a downside liquidity sweep may suggest that selling pressure is weakening and buyers are beginning to establish control. Monitor the green CISD level for potential price reactions, retests, and bullish continuation setups. **Bearish Trading Opportunities** Look for price sweeping a previous swing high, followed by a confirmed bearish CISD. A bearish CISD after an upside liquidity sweep may indicate that buying pressure is weakening and sellers are beginning to establish control. Monitor the red CISD level for potential bearish retests and continuation opportunities. **Higher-Timeframe Confirmation** Use a higher timeframe to evaluate the broader directional structure while monitoring lower-timeframe CISD events for potential entries. For example, traders using a 1-minute or 5-minute chart may display 15-minute or 1-hour CISD levels to identify important structural reference points. **CISD Level Retests** Extended CISD levels help traders identify areas where price may revisit a previous directional transition. Observe whether price respects or breaks these levels before considering a trade. **Trend Continuation and Reversal Analysis** Multiple bullish CISD events may suggest strengthening bullish pressure, while successive bearish events may suggest increasing bearish pressure. Conflicting signals between timeframes may indicate uncertainty or a developing market transition. **Risk Management** Use price structure, swing highs and lows, and clearly defined invalidation levels to manage trading risk. CISD signals should be confirmed using surrounding market conditions rather than treated as guaranteed reversal or entry signals.
Settings and Configuration
The [CT] MTF CISD w/Extensions indicator provides customizable controls for CISD detection, liquidity analysis, extended levels, higher-timeframe monitoring, and chart appearance. **Core Calculation Settings** - Noise Filter: Default 0.7. Controls CISD qualification sensitivity. - Swing Period: Default 12. Determines the lookback used for detecting swing highs and lows. - Expiry Bars: Default 100. Controls how long older liquidity levels remain active. - Liquidity Lookback: Default 10. Determines how recently an opposing liquidity level must have been swept to qualify for a sweep-associated CISD marker. **Current-Timeframe CISD Extensions** - Extend Recent CISD Levels: Enabled by default. - Number of Extended Levels: Default 3. - Right Extension: Default 10 bars beyond the current candle. - Maximum Stored CISD Levels: Default 120. These settings allow traders to display recent CISD levels beyond current price action while controlling historical chart clutter. **Higher-Timeframe Settings** - Show HTF CISD: Disabled by default. - Default HTF: 60 minutes. - Confirmed HTF Only: Enabled by default. - Maximum HTF Lines: 50. - HTF Line Width: 2. - HTF Line Style: Dashed. - Extend HTF Lines Right: Enabled. - Display HTF Labels: Enabled. - HTF Label Offset: 15 bars. - HTF Directional Markers: Enabled. - Optional HTF Trend-Based Candle Coloring. **Appearance Settings** - Bullish Color: Teal Green (#00FFBB). - Bearish Color: Red (#FF1100). - Candle Body Transparency: 90. - Candle Wick/Border Transparency: 40. - Hide Expired Liquidity Levels: Enabled. - Hide Mitigated Liquidity Levels: Disabled. **Suggested Starting Configuration** For intraday futures or forex trading: - Chart Timeframe: 1-minute or 5-minute. - Higher Timeframe: 15-minute or 60-minute. - Noise Filter: 0.7. - Swing Period: 12. - Liquidity Lookback: 10. - Extend Recent CISD Levels: Enabled. - Number of Extended Levels: 3. - Right Extension: 10 bars. - Confirmed Higher-Timeframe CISD: Enabled. These settings provide a starting framework and should be adjusted to match the instrument, market volatility, and individual trading strategy. Higher-timeframe CISD display must be enabled to show its levels and use HTF-based candle coloring.
This tool is designed to support a complete trading process with market context, defined risk, and clear invalidation. It is not a guarantee of future results.