
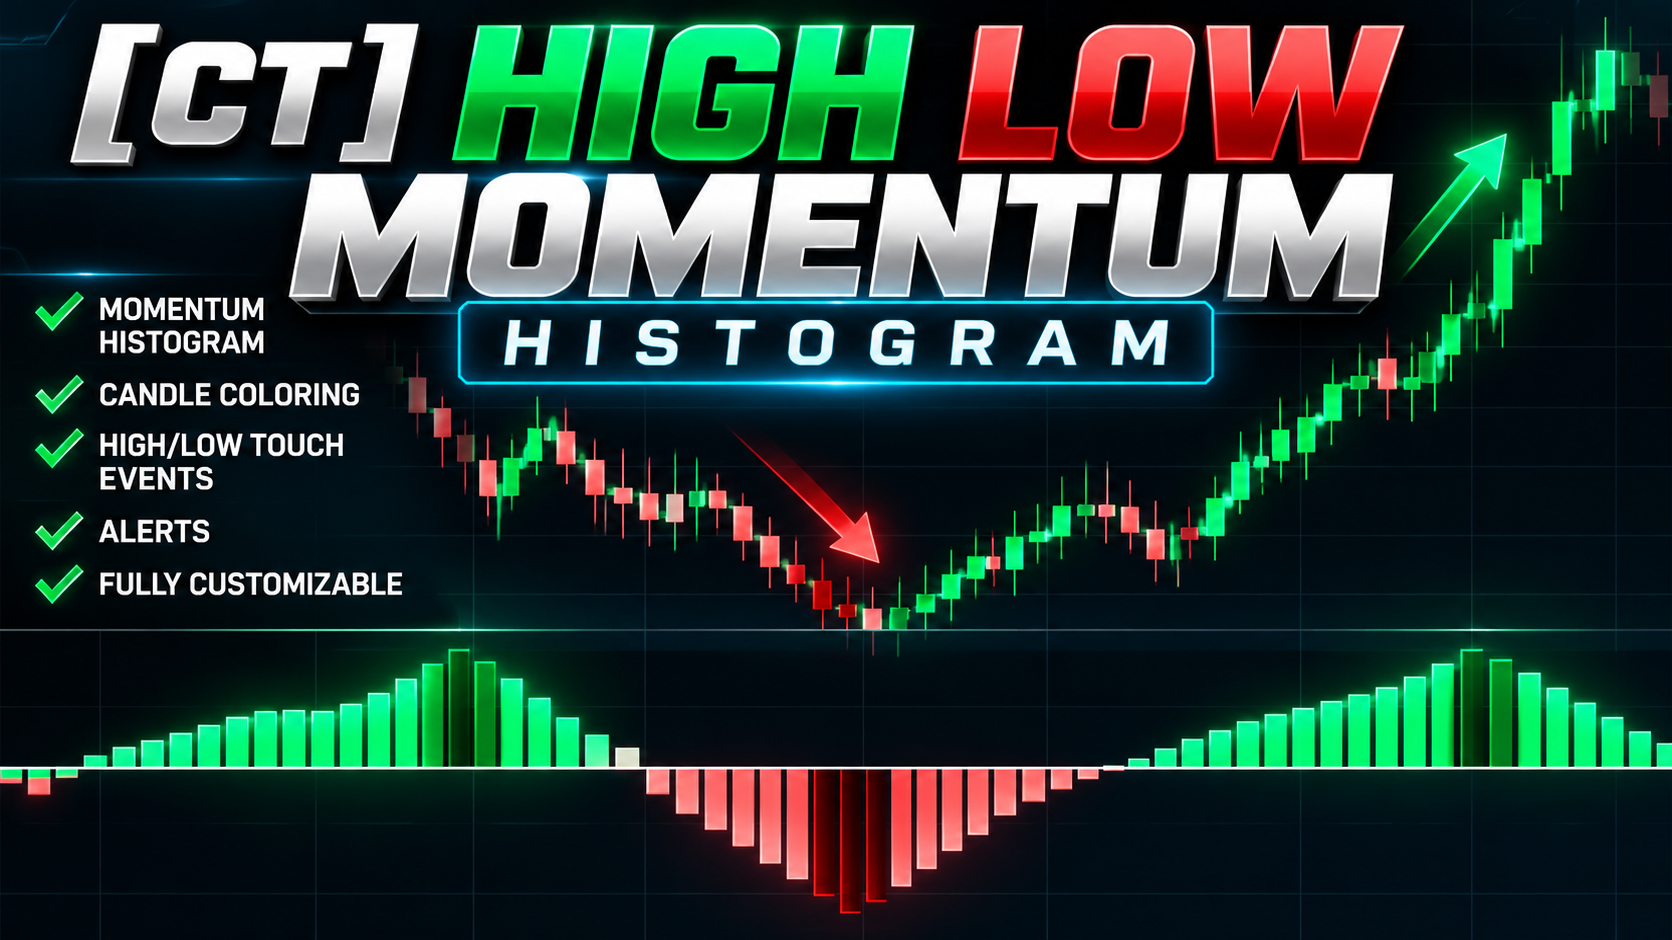
About [CT] High Low Momentum Histogram
The [CT] High Low Momentum Histogram is a Donchian-based momentum indicator designed to help traders recognize directional price progression, monitor bullish and bearish conditions, and identify changes in market behavior. The indicator tracks qualifying highs and lows within a customizable Donchian lookback period and displays the results as a color-coded histogram above and below a zero reference line. Positive histogram readings represent an active bullish counting state, while negative readings indicate an active bearish counting state. Darker histogram columns highlight qualifying high and low touches, providing additional visual information about price progression. An enhanced candle-coloring system brings the histogram's directional information directly onto the price chart, allowing traders to evaluate momentum without constantly switching their attention between panels. Originally adapted from the Don Walk indicator, this CT version introduces improved visualization, customizable candle colors, event highlighting, expanded alerts, and additional display controls. The indicator is designed to complement market structure, trend analysis, and price action rather than function as a standalone trading system.
What this indicator provides
- - Donchian-Based Momentum Histogram
- - Bullish & Bearish Trend Progression
- - Color-Coded Price Candles
- - Dark Green & Dark Red High/Low Touch Highlights
- - Adjustable Donchian Lookback
- - Customizable Histogram & Candle Colors
- - Bullish & Bearish Momentum Shift Alerts
- - Automatic Momentum Count Resets
- - Optional Zero Reference Line
- - Adjustable Histogram Column Width
- - Works Across All Chart Timeframes
- - Complements Market Structure, BOS & CHoCH Analysis
How It Works
The [CT] High Low Momentum Histogram uses Donchian high and low boundaries to monitor directional price progression. **Donchian Calculation** The indicator calculates the highest high and lowest low over a user-defined lookback period, including the current candle. When price reaches the upper Donchian boundary, the bullish count increases. When price reaches the lower Donchian boundary, the bearish count decreases. An opposite boundary touch resets the corresponding directional count. If both boundaries are touched on the same candle, both counts reset. **Histogram Interpretation** - **Dark Green:** Bullish counting state with a qualifying upper Donchian touch. - **Green:** Active bullish count without a qualifying upper touch on the current candle. - **Dark Red:** Bearish counting state with a qualifying lower Donchian touch. - **Light Red:** Active bearish count without a qualifying lower touch on the current candle. - **Gray:** Neutral state with no active directional count. **Price Candle Coloring** The optional candle-coloring feature applies the same directional conditions directly to the price chart. Traders can match the histogram colors or configure independent candle colors. **Alert Conditions** Alerts are available for qualifying upper and lower Donchian touches, as well as bullish and bearish transitions across the zero line. The histogram measures accumulated qualifying boundary touches, not the magnitude of price movement or the probability of a successful trade.
Suggested Usage
The [CT] High Low Momentum Histogram is best used as a directional momentum confirmation and trend-progression tool alongside market structure and price action. **Bullish Trading Conditions** Look for positive histogram readings that align with bullish market structure. Green bars indicate an active bullish counting state, while dark green bars identify qualifying Donchian high touches. Consider using these conditions to support long setups after bullish Breaks of Structure (BOS), higher lows, or pullbacks into established support areas. **Bearish Trading Conditions** Look for negative histogram readings that align with bearish market structure. Light red bars indicate an active bearish counting state, while dark red bars identify qualifying Donchian low touches. These conditions can support short setups following bearish BOS, lower highs, or rejection from established resistance areas. **Momentum Changes** Monitor transitions toward zero and changes between positive and negative readings. A reset can indicate a change in the underlying Donchian counting state, but does not independently confirm a trend reversal. **Using It With the CT Trading System** Within The Traders Vibe approach, the indicator can complement: - **[CT] Dual MTF Trend Structure:** Identify the prevailing market structure and directional bias. - **[CT] Dual MTF Trend Structure Histogram:** Evaluate directional alignment across timeframes. - **ABS Entry Indicator:** Identify potential entry timing after directional conditions align. - **Support and Resistance Zones:** Evaluate opportunities around important market structure levels. **Suggested Trading Process** 1. Establish directional bias using market structure. 2. Confirm that the momentum histogram supports the intended trade direction. 3. Identify a favorable price action setup near a meaningful level. 4. Use an independent entry confirmation tool. 5. Manage risk using predefined stops and position sizing. Avoid using histogram colors alone as automatic buy or sell signals.
Settings and Configuration
The [CT] High Low Momentum Histogram provides customizable settings for momentum analysis, histogram appearance, candle coloring, and alerts. **Donchian Settings** - **Donchian Lookback:** Default 20 candles. - Shorter lookbacks generally produce more frequent boundary touches. - Longer lookbacks require price to reach highs or lows over a larger historical window. **Histogram Display** - **Show Zero Line:** Enable or disable the zero reference line. - **Histogram Column Width:** Adjustable from 1 to 10. - **Bullish Color:** Default bright green. - **Bullish High Touch:** Default dark green. - **Bearish Color:** Default light red. - **Bearish Low Touch:** Default dark red. - **Neutral Color:** Default gray. **Candle Coloring** - **Enable Candle Coloring:** Turn chart candle coloring on or off. - **Match Histogram Colors:** Automatically apply histogram colors to candles. - **Highlight High/Low Touch Candles:** Use darker candle colors for qualifying Donchian boundary events. - **Color Neutral Candles:** Optional neutral coloring, disabled by default. - **Custom Candle Colors:** Independently configure bullish, bearish, event, and neutral candle colors. **Alert Settings** Available alerts include: - Donchian Upper Touch - Donchian Lower Touch - Bullish Momentum Started - Bearish Momentum Started **Timeframe Compatibility** The indicator calculates using the active chart timeframe and can be applied to intraday, daily, and higher-timeframe charts. It does not currently include an independent multi-timeframe calculation setting. **Recommended Starting Configuration** - Donchian Lookback: 20 - Histogram Width: 3 - Zero Line: Enabled - Candle Coloring: Enabled - Match Histogram Colors: Enabled - Highlight High/Low Touch Candles: Enabled - Neutral Candle Coloring: Disabled These are default starting settings rather than optimized trading parameters. Adjust them based on your trading instrument, timeframe, and strategy. **Original Indicator Credit** Adapted from the original Don Walk indicator, with the foundational counting logic retained. Pine Script v6 conversion, histogram visualization, candle coloring, display customization, and additional alerts were developed for the CT version by ChaosTrader63.
This tool is designed to support a complete trading process with market context, defined risk, and clear invalidation. It is not a guarantee of future results.