
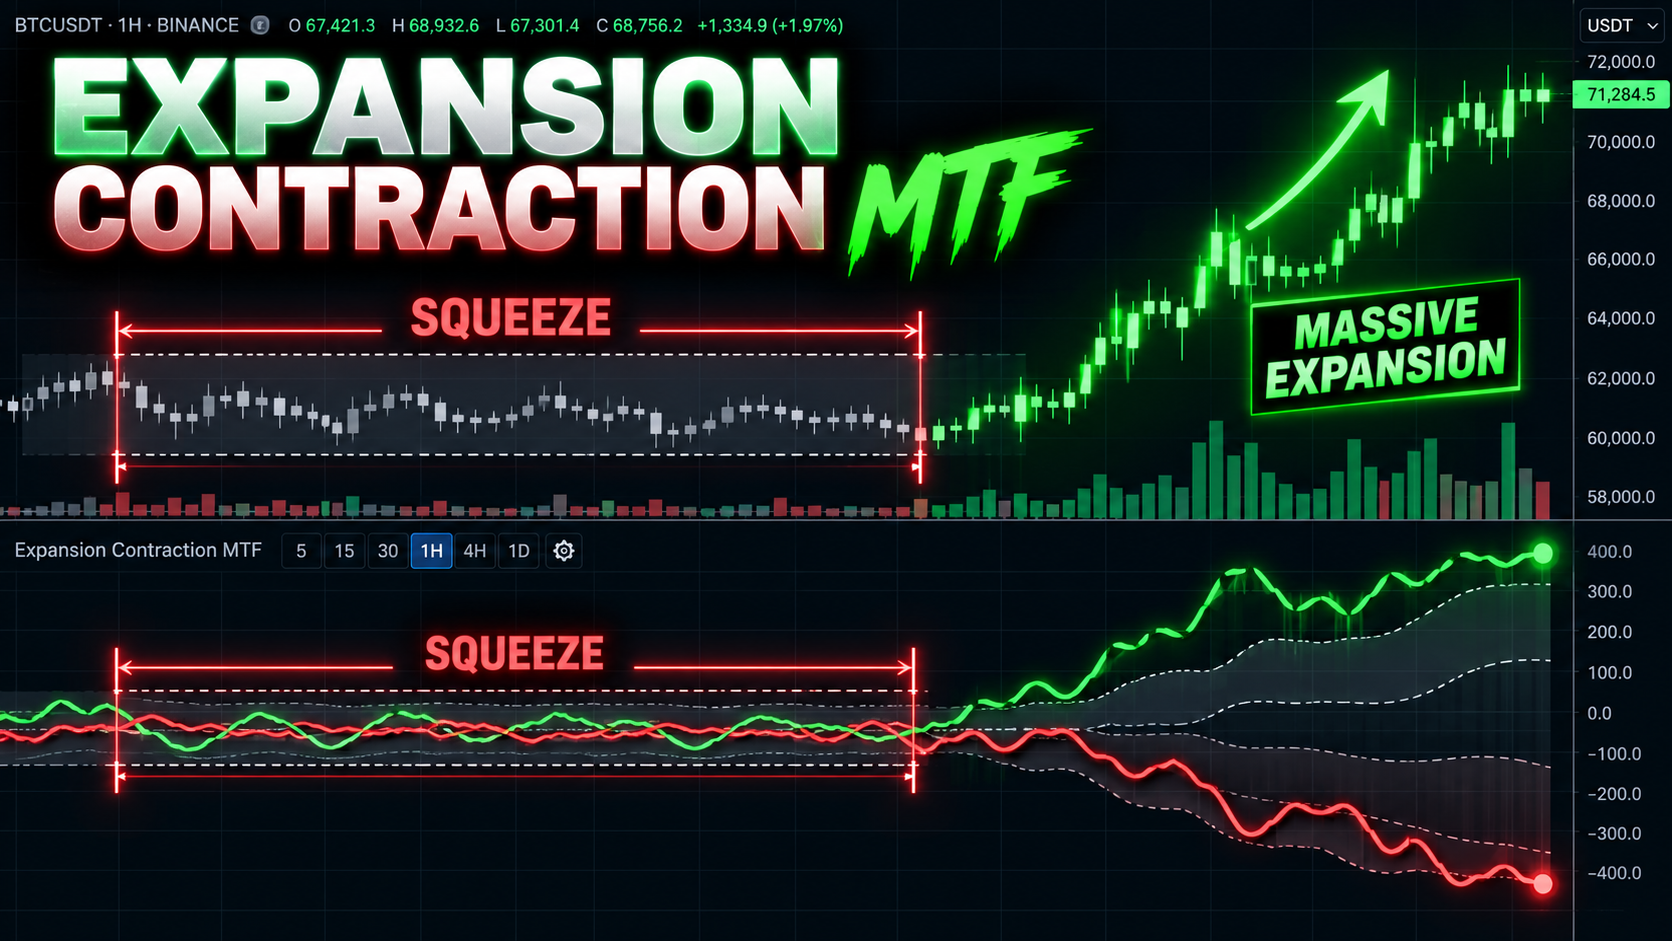
About [CT] Expansion Contraction MTF
The [CT] Expansion Contraction MTF is a multi-timeframe technical analysis indicator designed to help traders evaluate directional price pressure, momentum strength, and changing market conditions. By comparing price movement against short-term and long-term average high and low values, the indicator measures positive and negative expansion and contraction characteristics within the market. Four momentum lines display short-term and long-term bullish and bearish pressure, allowing traders to recognize when momentum is strengthening, weakening, or transitioning between directional states. The indicator also incorporates statistical volatility bands calculated using historical standard deviation, providing a reference for evaluating the magnitude of price movement relative to historical conditions. A customizable candle-coloring system distinguishes between strong bullish, strong bearish, weak bullish, and weak bearish conditions based on the agreement or disagreement between short-term and long-term directional signals. Multi-timeframe functionality allows traders to analyze momentum using either the active chart timeframe or a selected higher or lower timeframe. The primary objective is to help traders identify directional alignment, recognize changes in market pressure, and evaluate potential trend continuation or reversal opportunities when combined with price action and market structure.
What this indicator provides
- Multi-Timeframe Momentum Analysis
- Short-Term and Long-Term Directional Pressure
- Strong and Weak Bullish/Bearish Conditions
- Customizable Price Candle Coloring
- Historical Volatility Reference Bands
- Momentum Shift Identification
- Trend Continuation and Pullback Analysis
- Adjustable Lookback Periods and Timeframes
- Visual Bullish and Bearish Momentum Comparison
- Compatible with Stocks, Futures, Forex, and Crypto
How It Works
The indicator calculates positive and negative price-pressure values using two independently configurable lookback periods. **Short-Term Momentum Lines** - Bright Green: Positive short-term momentum. - Red: Negative short-term momentum. **Long-Term Momentum Lines** - Dark Green: Positive long-term momentum. - Maroon: Negative long-term momentum. **Directional Conditions** Strong Bullish: Both short-term and long-term positive momentum exceed their corresponding negative momentum values. Weak Bullish: Long-term momentum remains bullish while short-term momentum turns bearish, suggesting a possible pullback or temporary weakening. Strong Bearish: Both short-term and long-term negative momentum exceed their corresponding positive momentum values. Weak Bearish: Long-term momentum remains bearish while short-term momentum turns bullish, suggesting a possible retracement or temporary weakening. **Volatility Reference Bands** Gray upper and lower reference bands are calculated using historical averages and standard deviation of the maximum directional pressure measurements. Additional outer bands are displayed at twice the long-term upper-band value. These levels help traders compare current momentum measurements with historical volatility conditions. **Zero Line** A dashed horizontal zero line provides a central reference for evaluating positive and negative oscillator values. **Candle Coloring** When enabled, price candles automatically change color according to the current bullish or bearish strength classification. The indicator supports both chart-timeframe and user-selected multi-timeframe calculations.
Suggested Usage
The [CT] Expansion Contraction MTF indicator is best used as a directional momentum and market-condition filter alongside price action, support and resistance, and market structure analysis. **Bullish Trading Opportunities** Look for situations where both short-term and long-term positive momentum dominate their corresponding negative momentum values. Strong bullish candle coloring indicates directional agreement and may support long opportunities when price action confirms the setup. **Bearish Trading Opportunities** Look for situations where both short-term and long-term negative momentum dominate their corresponding positive momentum values. Strong bearish candle coloring indicates directional agreement and may support short opportunities when price action confirms the setup. **Pullbacks and Retracements** Weak bullish or bearish conditions highlight disagreements between short-term and long-term momentum. Traders can monitor these periods for potential pullback entries or early indications of changing market conditions. **Momentum Transitions** Observe changes in the relationships between the positive and negative momentum lines. Directional crossovers and changes in separation may help identify strengthening or weakening price pressure. **Multi-Timeframe Confirmation** Use a higher timeframe to establish the broader directional bias while monitoring a lower timeframe for price-action entries. For best results, combine the indicator with fractal breaks, market structure, support and resistance, or other established entry techniques. The indicator is designed to provide analytical confirmation rather than standalone buy or sell signals.
Settings and Configuration
The [CT] Expansion Contraction MTF indicator includes customizable calculation, timeframe, and display settings. **Core Settings** - Use Chart Timeframe: Enabled by default. Calculates the indicator using the active chart timeframe. - MTF Timeframe: Default 60 minutes. Allows calculations using a selected timeframe when chart-timeframe mode is disabled. - Short Lookback: Default 8 periods. Controls short-term directional sensitivity. - Long Lookback: Default 32 periods. Measures broader directional pressure. - StDev Lookback: Default 500 periods. Determines the historical period used for calculating statistical volatility reference bands. **Display Settings** Color Price Candles: Enabled by default. Applies directional momentum colors to price candles. **Customizable Candle Colors** - Weak Bullish: Transparent Green. - Weak Bearish: Transparent Red. - Strong Bullish: Green. - Strong Bearish: Red. - Neutral: Gray. **Recommended Starting Configuration** For intraday trading, begin with the default 8-period short lookback, 32-period long lookback, and 500-period standard deviation setting. Traders using 1-minute or 5-minute charts may experiment with a 15-minute or 60-minute calculation timeframe to evaluate broader momentum conditions. Shorter lookback periods generally increase sensitivity, while longer periods provide smoother directional measurements. Higher-timeframe values may change while the selected timeframe candle remains open. Traders should account for this when evaluating live signals.
This tool is designed to support a complete trading process with market context, defined risk, and clear invalidation. It is not a guarantee of future results.