
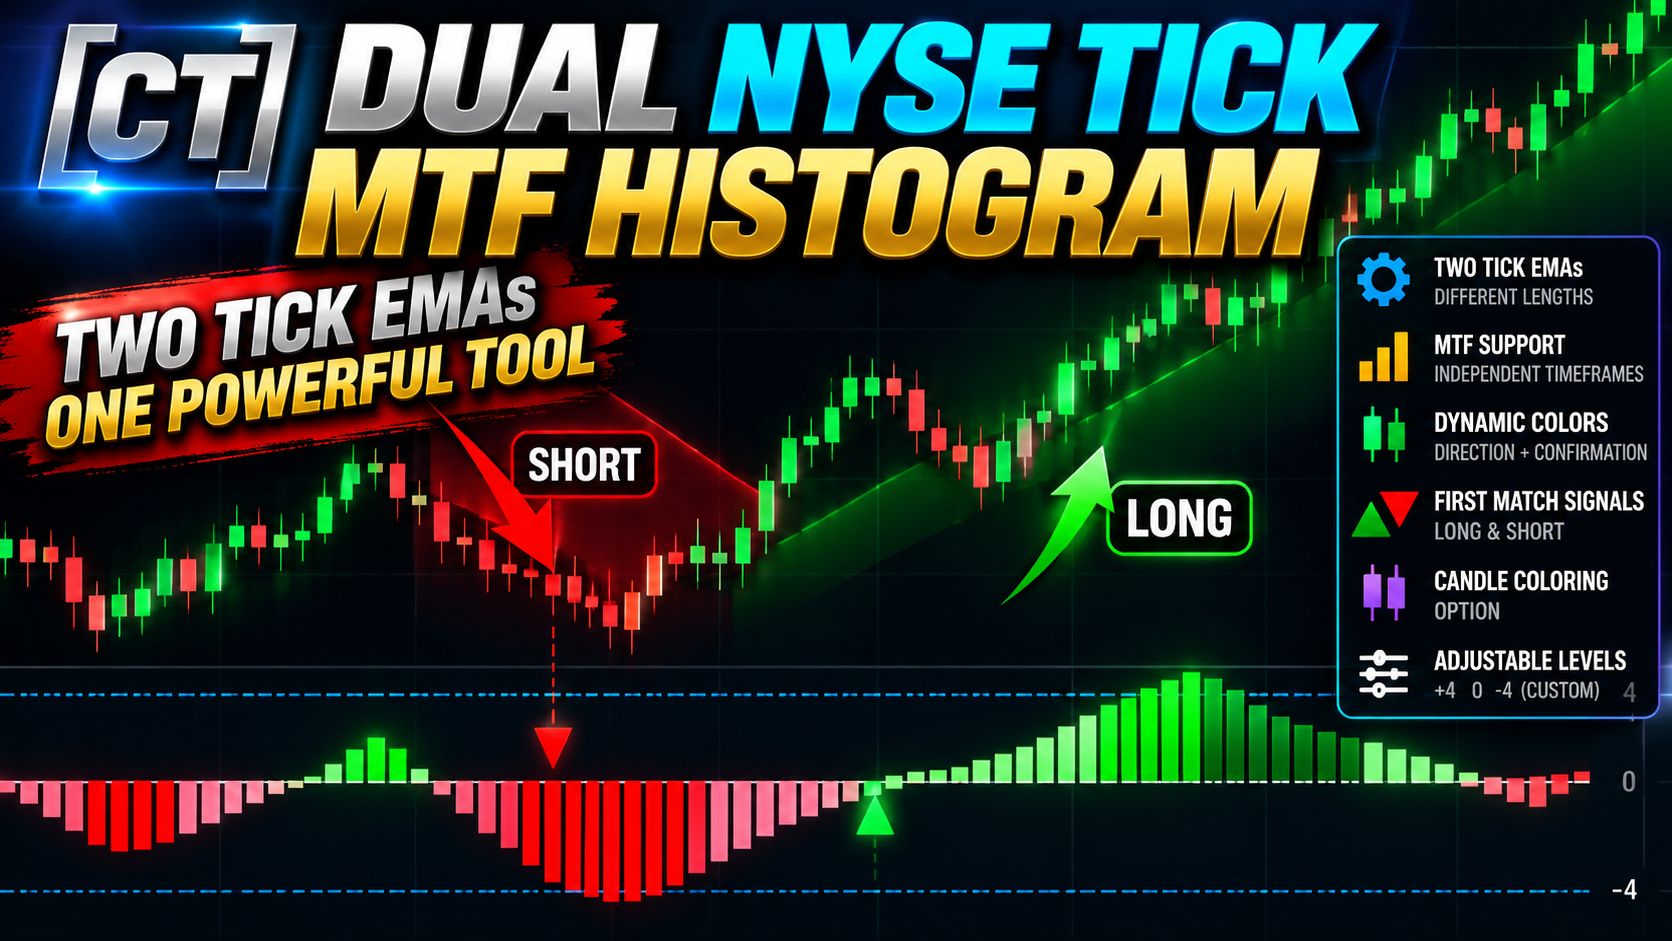
About [CT] Dual NYSE TICK MTF Histogram
The **[CT] Dual NYSE TICK MTF Histogram** is a momentum and trend-confirmation indicator designed to help traders identify market direction, evaluate momentum strength, and recognize potential entry opportunities when short-term momentum aligns with the primary trend. The indicator uses two independently adjustable simulated NYSE TICK exponential moving averages (EMAs). The main EMA establishes the bullish or bearish directional bias, while the confirmation EMA determines whether shorter-term momentum supports that direction. This approach helps traders distinguish between strong directional alignment and temporary countertrend momentum during pullbacks or consolidations. The indicator includes multi-timeframe functionality, four-color histogram visualization, optional price-candle coloring, first-alignment LONG/SHORT signals, customizable reference levels, and alerts. **Important:** This indicator calculates a simulated TICK from the selected instrument's price movement. It does not use actual NYSE market-breadth TICK data.
What this indicator provides
- - **Dual TICK EMA System:** Combines two independently adjustable simulated NYSE TICK EMAs for directional momentum and confirmation.
- - **Multi-Timeframe Analysis:** Select different timeframes for the main and confirmation EMAs.
- - **Four-Color Momentum Histogram:** Dark green/red identifies momentum alignment; light green/red identifies opposing short-term momentum.
- - **Early Momentum Confirmation:** Highlights when faster momentum realigns with the primary direction after a pullback.
- - **LONG & SHORT Signals:** Optional signals identify the first confirmed alignment of both EMAs.
- - **Optional Candle Coloring:** Applies the same four-color momentum system directly to price candles.
- - **Adjustable Reference Levels:** Customizable +4, 0, and −4 levels help visualize momentum strength.
- - **Customizable Settings:** Adjust EMA lengths, timeframes, colors, histogram display, and signals.
- - **TradingView Alerts:** Receive notifications when new bullish or bearish momentum alignment occurs.
- - **Trend-Following Compatibility:** Designed to complement market structure, price action, and other Traders Vibe indicators.
How It Works
The indicator calculates simulated TICK values using each candle's opening and closing prices divided by the instrument's minimum tick size. Two exponential moving averages smooth these values to establish momentum direction and confirmation. **Main TICK EMA (Default: 50):** Determines the primary bullish or bearish direction. **Confirmation TICK EMA (Default: 10):** Determines whether faster momentum agrees with the primary direction. **Histogram Colors:** - **Dark Green:** Both EMAs are bullish, indicating bullish momentum alignment. - **Light Green:** Main EMA is bullish, but the confirmation EMA is bearish, indicating weaker bullish confirmation. - **Dark Red:** Both EMAs are bearish, indicating bearish momentum alignment. - **Light Red:** Main EMA is bearish, but the confirmation EMA is bullish, indicating weaker bearish confirmation. The histogram displays the main EMA's momentum value above or below zero. **LONG Signal:** Appears when both EMAs first align bullish. **SHORT Signal:** Appears when both EMAs first align bearish. Signals are optional and appear on initial alignment rather than every subsequent matching candle. **Additional Features:** - Independent timeframe selection for each EMA. - Optional price-candle coloring using the histogram's four-color logic. - Adjustable upper and lower reference levels, defaulting to +4 and −4. - Zero reference line separating positive and negative momentum. - Customizable colors and signal alerts. Higher-timeframe readings can change while their source candles are still forming.
Suggested Usage
The **[CT] Dual NYSE TICK MTF Histogram** is designed to serve as a momentum-confirmation and trade-entry timing tool within The Traders Vibe trading methodology. **Bullish Trade Setups:** First establish a bullish market direction using price action or market structure, such as the [CT] Dual MTF Trend Structure indicator. When the histogram is light green, the main momentum direction remains bullish, but shorter-term momentum is opposing it. Watch for the histogram to transition to dark green, indicating renewed bullish alignment. Combine this transition with bullish price action, support, higher lows, or a confirmed structure continuation before considering an entry. **Bearish Trade Setups:** Identify a bearish market direction using market structure or price action. A light-red histogram indicates that shorter-term momentum is opposing the primary bearish direction. When the histogram transitions to dark red, both momentum readings agree bearish. This may provide additional confirmation for a short entry near resistance, following a lower high, or after a bearish structure break. **Pullback Trading:** One potential application is identifying momentum realignment following pullbacks. - Dark Green → Light Green → Dark Green may indicate renewed bullish momentum. - Dark Red → Light Red → Dark Red may indicate renewed bearish momentum. **Multi-Timeframe Trading:** Use a higher timeframe for the main EMA and a lower timeframe for confirmation to help align entries with broader momentum. The indicator should be used alongside market structure, support and resistance, price action, and disciplined risk management. Momentum alignment does not guarantee price continuation.
Settings and Configuration
**Recommended Starting Settings** - **Main TICK EMA Length:** 50 - **Confirmation TICK EMA Length:** 10 - **Main Timeframe:** Current chart timeframe - **Confirmation Timeframe:** Current chart timeframe - **Histogram Display:** Enabled - **Candle Coloring:** Optional - **LONG/SHORT Signals:** Enabled - **Upper Reference Level:** +4 - **Zero Level:** 0 - **Lower Reference Level:** −4 **Multi-Timeframe Example for NQ Futures:** For a 1-minute trading chart: - Main TICK EMA: 50 on the 5-minute timeframe. - Confirmation TICK EMA: 10 on the 1-minute timeframe. This configuration uses the broader timeframe to determine primary momentum while monitoring shorter-term alignment for potential entries. **Adjusting Sensitivity:** Shorter EMA lengths react more quickly to changes in candle momentum but may produce additional color changes and signals. Longer EMA lengths provide smoother momentum readings but react more slowly to changing market conditions. **Reference Levels:** The default +4 and −4 lines provide visual momentum reference points. These are adjustable and should not automatically be interpreted as overbought or oversold levels. **Color Interpretation:** Dark colors indicate agreement between both EMAs. Light colors indicate that the confirmation EMA is opposing the main EMA. **Trading Considerations:** Settings should be adjusted according to the instrument, chart timeframe, market volatility, and trading strategy. When using higher timeframes, developing readings may change before the higher-timeframe candle closes. For best results, use the indicator as a momentum confirmation tool rather than a standalone trade-entry system.
This tool is designed to support a complete trading process with market context, defined risk, and clear invalidation. It is not a guarantee of future results.