
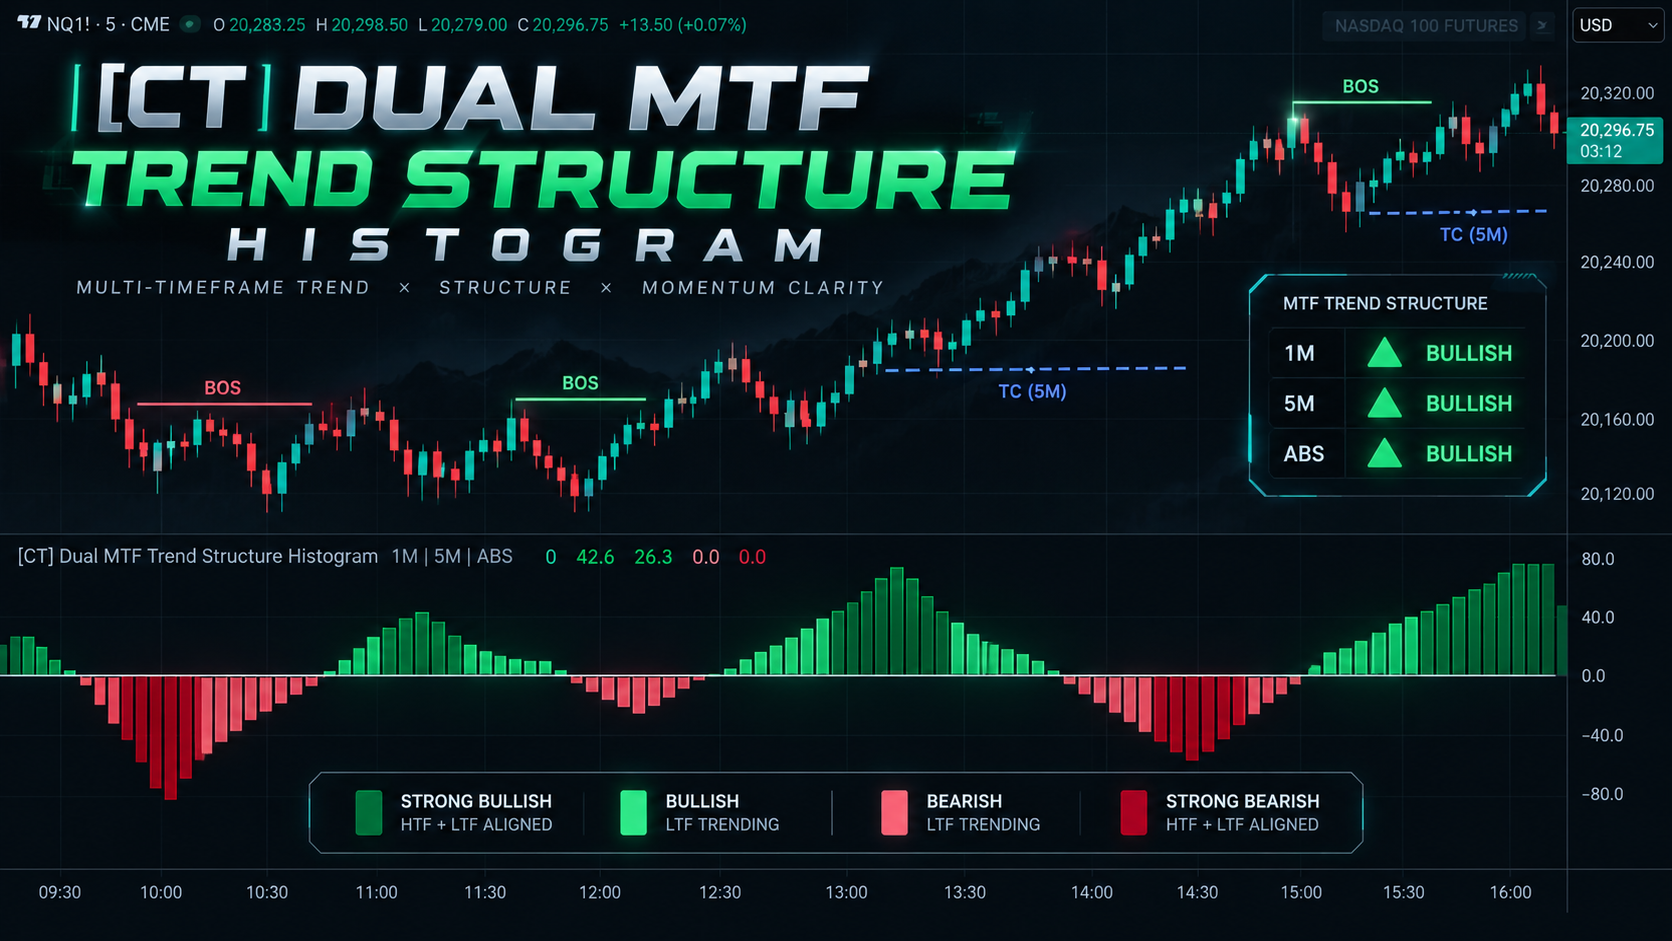
About [CT] Dual MTF Trend Structure Histogram
[CT] Dual MTF Trend Structure Histogram is designed to help traders quickly evaluate whether the current market structure is bullish, bearish, or mixed across two timeframes while also measuring momentum strength through the ABS engine. The indicator blends three core ideas into one tool: 1. Market Structure Direction using Break of Structure (BOS) and Trend Change (TC) logic 2. Higher Timeframe Confirmation so traders can compare local structure against broader directional bias 3. ABS Momentum / Streak Analysis to measure whether momentum is supporting the current structural read This helps solve a common trading problem: a trader may see a move on the chart timeframe, but not know whether it is aligned with the higher timeframe or whether momentum is actually supporting the move. This tool brings those elements together in one view so traders can quickly assess trend quality, alignment, and potential continuation or caution conditions.
What this indicator provides
- Dual timeframe structure analysis
- Chart TF and higher TF BOS / TC logic
- ABS momentum confirmation histogram
- Optional BOS and TC line display
- Optional candle coloring
- Higher timeframe alignment filter
- Helps confirm continuation vs caution
- Useful for trend-following and pullback setups
How It Works
The indicator tracks structure on both the chart timeframe and a selected higher timeframe using pivot-based BOS and TC logic. • BOS (Break of Structure) identifies continuation breaks in the direction of trend. • TC (Trend Change) identifies structure flips that suggest a potential directional shift. • A histogram is plotted below price to show either: o Structural Trend mode, or o ABS Momentum mode Structure Logic • The script calculates structure separately for the chart timeframe and the higher timeframe. • The user can choose whether the histogram reflects: o the chart timeframe trend o the higher timeframe trend o or only periods where both timeframes agree ABS Engine The indicator also includes the Adaptive Breakout Streak (ABS) engine, which measures momentum quality by evaluating breakout behavior bar by bar. ABS is used for: • histogram strength and direction • optional candle coloring • agreement/disagreement logic between structure and momentum Histogram Color Interpretation • Dark Green = bullish structure with bullish ABS agreement • Original / Brighter Green = bullish structure without strong ABS agreement • Dark Red = bearish structure with bearish ABS agreement • Light Red = bearish structure without strong ABS agreement • Gray / Neutral = no clear directional agreement or neutral condition Visual Features Depending on settings, the indicator can also display: • Chart timeframe BOS and TC lines • Higher timeframe BOS and TC lines • Optional candle coloring • Optional higher timeframe histogram with lower timeframe candle coloring • Alignment-based visual confirmation This allows traders to quickly see whether market structure and momentum are confirming one another or beginning to diverge.
Suggested Usage
General Workflow 1. Start with the higher timeframe - Identify whether the higher timeframe structure is bullish or bearish. - This gives you the broader directional bias. 2. Check the chart timeframe - Look for BOS or TC signals that align with the higher timeframe. - This helps you determine whether current price action is continuing or attempting to reverse. 3. Use the histogram for confirmation - Strong positive histogram with bullish structure supports long setups. - Strong negative histogram with bearish structure supports short setups. - Weak or mixed histogram may signal caution, consolidation, or reduced momentum. 4. Use candle coloring as a quick state read - Candle color helps identify whether local price behavior is supporting the broader trend. - This is especially useful when scanning charts quickly. Best Use Cases - Trend-following entries - Pullback continuation setups - Higher timeframe alignment confirmation - Avoiding low-quality countertrend trades - Separating strong structure from weak structure Important Note This indicator is best used as a decision support tool, not as a standalone entry trigger. It should be combined with your levels, execution model, and overall market context.
Settings and Configuration
The indicator is organized into clear setting groups so the user can control timeframe logic, structure detection, histogram behavior, candle coloring, and visual display. 1. Timeframes & Structure - Higher Timeframe: sets the confirmation timeframe - Chart Pivot Left / Right: controls pivot sensitivity on the chart timeframe - HTF Pivot Left / Right: controls pivot sensitivity on the higher timeframe - Structure Break Confirmation: - Close = more conservative - Wick = more aggressive / earlier 2. Histogram - Histogram Mode: - Structural Trend - ABS Momentum - Trend Source: - Chart TF - Higher TF - Both Agree - Structural Bar Height: - ABS Strength + Floor - Fixed Height - Minimum Height / ABS Height Cap: adjusts structural histogram size - Column Width: controls bar thickness 3. ABS Engine - Use Prior Candle Body for Breaks: important for ABS alignment behavior - Neutral Streak Decay: controls how quickly ABS fades when no valid breakout is present 4. Colors Customize: - bullish strong color - bullish base color - bearish strong color - bearish base color - neutral color 5. BOS / TC Line Display Optional controls allow the user to show or hide: - chart timeframe BOS - chart timeframe TC - higher timeframe BOS - higher timeframe TC 6. Candle Coloring The user can enable candle coloring and choose whether candle color follows: - chart timeframe trend - higher timeframe trend - or another selected source depending on current build behavior Recommended Starting Configuration - Higher Timeframe: 5x to 15x the chart timeframe - Break Confirmation: Close - Trend Source: Higher TF or Both Agree - Histogram Mode: Structural Trend - Use Prior Candle Body for Breaks: Enabled These settings generally provide cleaner signals and better alignment.
This tool is designed to support a complete trading process with market context, defined risk, and clear invalidation. It is not a guarantee of future results.