
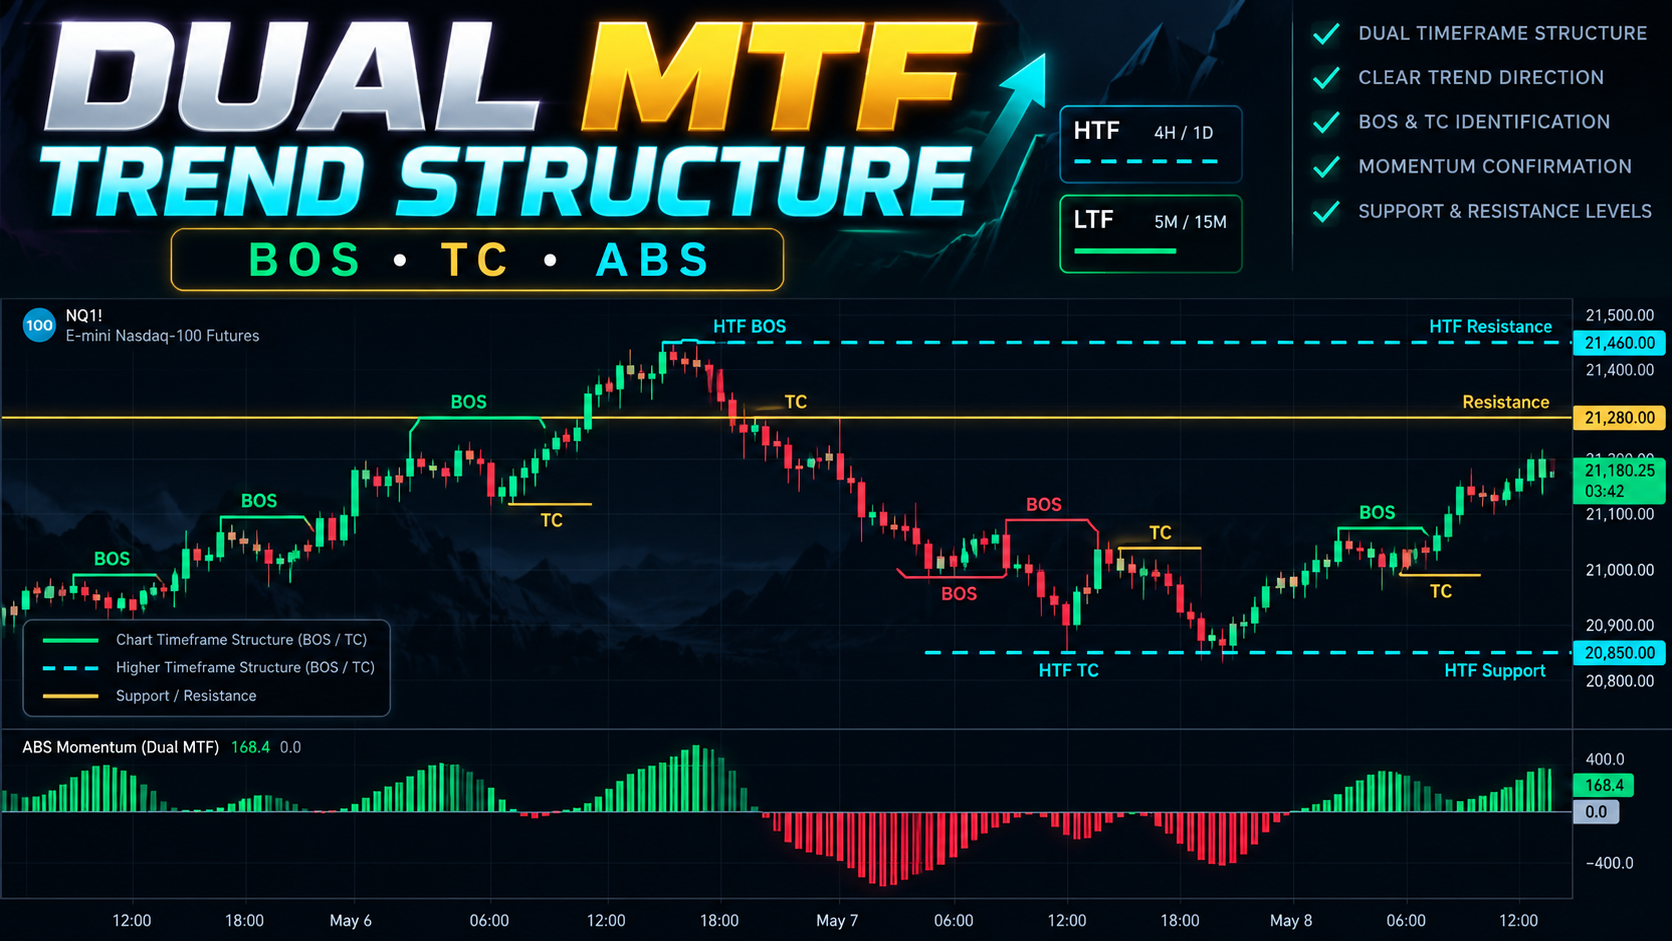
About [CT] Dual MTF Trend Structure
[CT] Dual MTF Trend Structure is a comprehensive market structure and trend-following indicator designed to help traders identify market direction, structural breakouts, potential reversals, and momentum confirmation across two independent timeframes. The indicator simultaneously analyzes the current chart timeframe and a selectable higher timeframe, identifying Break of Structure (BOS) and Trend Change (TC) events using confirmed swing highs and swing lows. An integrated Adaptive Breakout Streak (ABS) engine measures breakout pressure and controls candle-color intensity without overriding the established structural trend. The indicator also includes customizable support and resistance levels, breakout arrows, dual-timeframe agreement signals, alerts, and an information dashboard. Its primary purpose is to help traders distinguish between trend continuation, temporary pullbacks, and potential structural reversals while maintaining awareness of the higher-timeframe market direction.
What this indicator provides
- Independent Chart and Higher-Timeframe BOS/TC Detection
- Dual-Timeframe Structural Trend Analysis
- Adaptive Breakout Streak Momentum Confirmation
- Intelligent Four-Color Trend Candle System
- Solid Chart TF and Dashed HTF Structure Lines
- Horizontal Multi-Timeframe Support and Resistance
- Bullish and Bearish Trend Change Identification
- Dual-Timeframe ABS Agreement Signals
- Customizable Breakout Arrows and Alerts
- Real-Time Structure and Momentum Dashboard
How It Works
**Break of Structure (BOS):** Identifies a price break through a confirmed swing level in the direction of the existing market structure. A bullish BOS indicates continuation of bullish structure, while a bearish BOS indicates continuation of bearish structure. **Trend Change (TC):** Identifies a structural break against the previously established direction. A bullish TC changes bearish structure to bullish, while a bearish TC changes bullish structure to bearish. **Dual-Timeframe Analysis:** The chart timeframe and selected higher timeframe calculate their market structures independently. Solid lines identify chart-timeframe BOS/TC events, while dashed lines identify higher-timeframe events. **ABS Candle Coloring:** The structural trend controls whether candles are bullish or bearish. ABS determines the color intensity: - Dark Green: Bullish structure with positive ABS pressure. - Original Green: Bullish structure with negative or neutral ABS pressure. - Dark Red: Bearish structure with negative ABS pressure. - Light Red: Bearish structure with positive or neutral ABS pressure. **Support and Resistance:** Confirmed pivot highs and lows produce horizontal support and resistance levels. Chart-timeframe levels use solid lines and higher-timeframe levels use dashed lines. **Agreement Signals:** Optional markers identify when the chart timeframe, higher timeframe, and ABS momentum all agree in the same direction. **Information Dashboard:** Displays chart structural direction, higher-timeframe direction, timeframe agreement, and the current ABS reading.
Suggested Usage
Use [CT] Dual MTF Trend Structure as a directional market structure and confirmation tool within your trading process. **Step 1 — Establish the Higher-Timeframe Trend** Identify whether the selected higher timeframe is bullish or bearish. Use this as the primary directional context. **Step 2 — Evaluate Chart-Timeframe Structure** Monitor chart-timeframe BOS and TC events to identify continuation opportunities, pullbacks, and potential changes in the local trend. **Step 3 — Observe ABS Momentum** Dark-green candles indicate positive breakout pressure within bullish structure. Dark-red candles indicate negative breakout pressure within bearish structure. Lighter colors identify periods when ABS is not aligned with the prevailing structural direction. **Step 4 — Look for Timeframe Agreement** Bullish conditions strengthen when both structural timeframes are bullish and ABS is positive. Bearish conditions strengthen when both timeframes are bearish and ABS is negative. **Step 5 — Plan Entries and Risk** Use structural levels, support/resistance, and price action to evaluate entries, stops, and potential targets. A BOS or TC should not be treated as a guaranteed trade signal. For intraday futures trading, the higher timeframe can establish directional context while the lower timeframe helps refine execution. Always evaluate market volatility, risk, and position sizing before entering a trade.
Settings and Configuration
**Recommended Starting Configuration — Intraday Futures** - Chart Timeframe: 1 minute - Higher Timeframe: 5 minutes - Chart Pivot Left / Right: 3 / 3 - Higher-Timeframe Pivot Left / Right: 3 / 3 - Structure Break Confirmation: Close - Structural Candle Coloring: Higher TF - ABS Prior Candle Body Breaks: Enabled - Chart BOS / TC Lines: Enabled - Higher-Timeframe BOS / TC Lines: Enabled - Support / Resistance: Enable as needed - Dual-Timeframe ABS Agreement Signals: Optional - Information Dashboard: Enabled **Configuration Notes** Chart and higher-timeframe BOS/TC lines can be displayed independently. Line colors, widths, label sizes, and horizontal label offsets are customizable. Support and resistance lines are anchored to confirmed pivot candles and can be configured for rightward extension. Candle coloring can follow chart-timeframe structure, higher-timeframe structure, or require agreement between both. ABS settings control breakout calculations and candle-color intensity. To maintain consistency with the separate ABS histogram, use matching breakout settings, especially the prior-candle body-break option. Pivot confirmation requires subsequent completed candles. Higher-timeframe structure uses completed higher-timeframe data, so signals may appear later than the initial price movement.
This tool is designed to support a complete trading process with market context, defined risk, and clear invalidation. It is not a guarantee of future results.
How To Use The TC Dual MTF Trend Structure
Short video to help you understand how to use this indicator!
Public indicator preview