
About [CT] Donchian Histogram w/Candle Colors
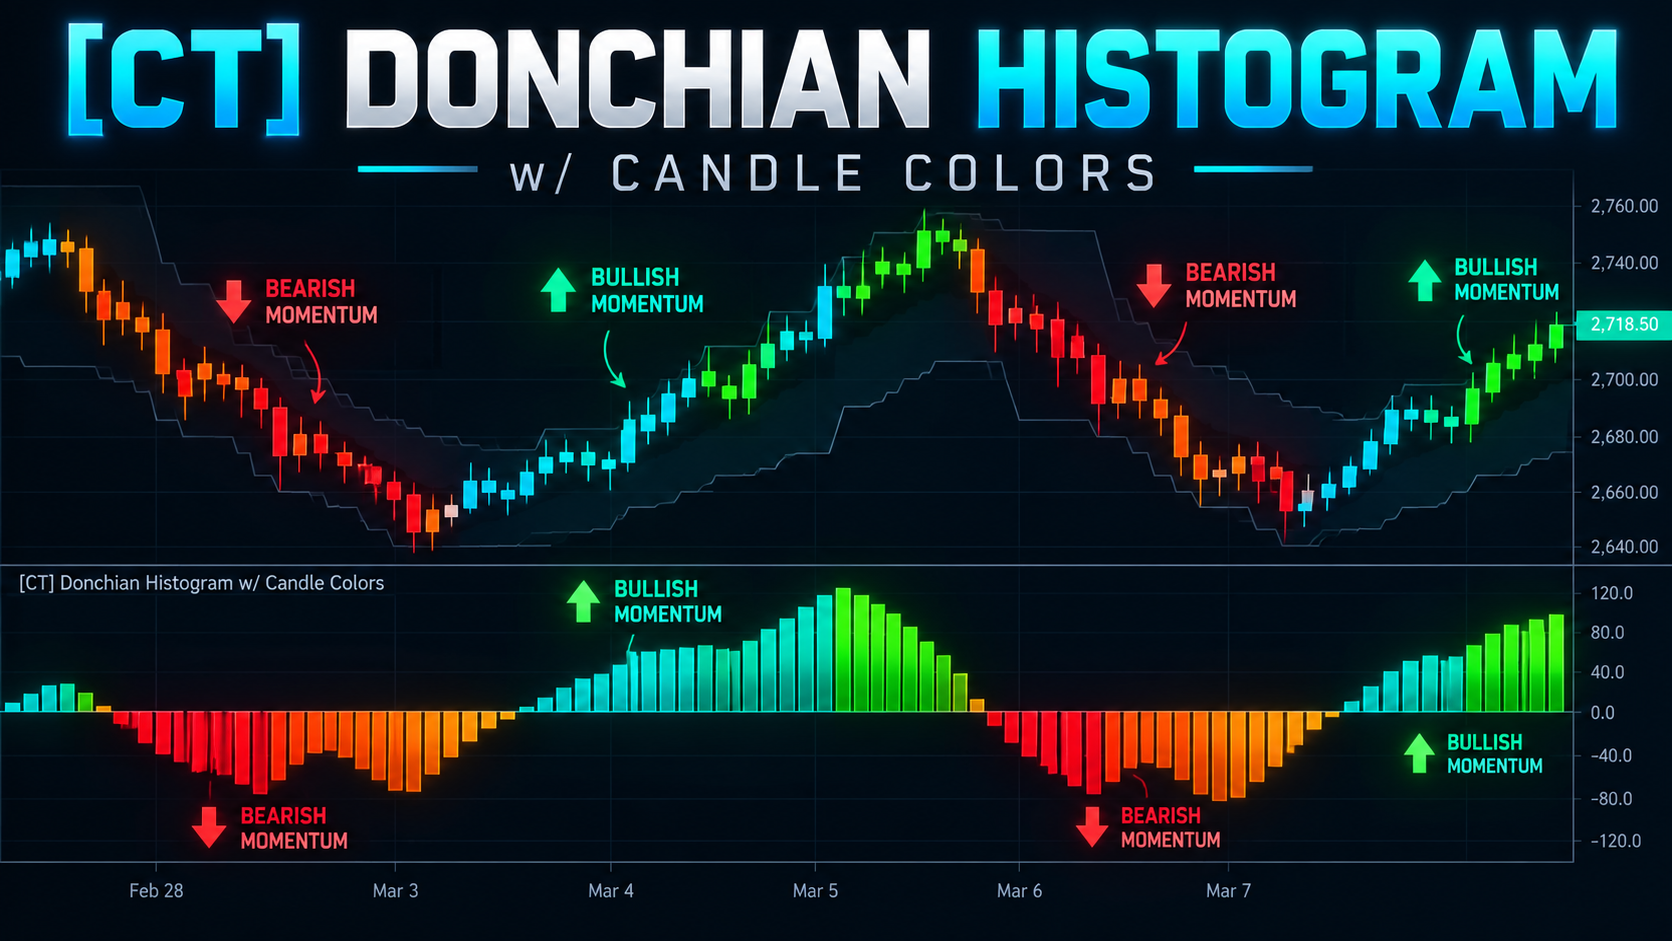
The [CT] Donchian Histogram w/Candle Colors transforms traditional Donchian Channel analysis into a visual oscillator designed to help traders evaluate market direction and changes in price positioning. Rather than displaying only the upper and lower boundaries of a Donchian Channel, the indicator calculates the current closing price's position within a historical highest-high and lowest-low range and converts that relationship into a histogram centered around zero. Positive histogram values indicate that price is positioned in the upper half of the calculated range, while negative values indicate that price is positioned in the lower half. The farther the histogram extends from zero, the closer price is positioned toward the corresponding extreme of the calculated range. A configurable smoothing period helps reduce short-term fluctuations in the oscillator. The indicator uses four histogram colors—teal, lime, red, and orange—to distinguish different directional states based on the oscillator's value and its relationship to the configured signal threshold. An optional candle-coloring feature applies the same colors to the main price chart, allowing traders to evaluate the indicator's conditions without constantly looking at the lower panel. The Donchian Histogram can be used to evaluate bullish and bearish price positioning, identify developing directional changes, and provide additional context for breakout, pullback, and trend-following strategies. It is suitable for futures, forex, stocks, and cryptocurrency markets and can complement price action, market structure, and other technical analysis methods.
What this indicator provides
- Donchian Price-Range Momentum Histogram
- Four-Color Directional Visualization
- Automatic Matching Candle Colors
- Bullish and Bearish Price Position Analysis
- Zero-Line Directional Reference
- Customizable Signal Smoothing
- Configurable Historical Lookback Scaling
- Trend Continuation and Pullback Analysis
- Directional Market Condition Filtering
- Price-Position Momentum Changes
- Compatible with Futures, Forex, Stocks, and Crypto
- Designed for Intraday and Trend-Following Analysis
How It Works
The indicator calculates a Donchian price range, measures the current closing price's position within that range, and displays the result as a color-coded histogram. **1. Donchian Range Calculation** The indicator identifies the highest high and lowest low over a calculated historical lookback period. - Upper Boundary: Highest high over the lookback period. - Lower Boundary: Lowest low over the lookback period. The lookback is derived from the Donchian Timeframe input and the active chart timeframe, using the original script's built-in scaling formula. **2. Price Position Calculation** The indicator measures the closing price's position within the Donchian range. The underlying calculation simplifies to: Histogram Base = ((Close - Range Midpoint) / Range Width) × 100 The Range Midpoint is halfway between the highest high and lowest low. The unsmoothed value is approximately +50 when price closes at the highest high, zero at the midpoint, and -50 at the lowest low. **3. Signal Smoothing** A Simple Moving Average (SMA) is applied to the calculated price-position value. The default Signal Lookback is 2 periods. This produces the final histogram value. **4. Histogram Interpretation** - Above Zero: Closing-price positioning favors the upper half of the Donchian range. - Below Zero: Closing-price positioning favors the lower half. - Near Zero: Closing price is positioned near the center of the range, on average over the smoothing period. - Far Above Zero: Price has recently been positioned closer to the upper range boundary. - Far Below Zero: Price has recently been positioned closer to the lower range boundary. **5. Four-Color Histogram** The indicator uses the following color conditions: - Teal: Histogram is nonnegative and greater than the Signal Lookback value. - Lime: Histogram is positive but below the Signal Lookback value. - Red: Histogram is negative and below the Signal Lookback value. - Orange: Remaining conditions, including certain zero or threshold-boundary readings. These colors represent the indicator's programmed threshold classifications. They do not directly measure whether the histogram is increasing or decreasing from one candle to the next. **6. Automatic Candle Coloring** When enabled, the price candles on the main chart use the same color as the histogram. This provides a consistent visual connection between the oscillator and current price action.
Suggested Usage
The [CT] Donchian Histogram w/Candle Colors can be used as a directional market filter and price-position confirmation tool. **Bullish Trading Opportunities** Look for histogram readings above zero, particularly when the indicator displays teal or lime coloring. These conditions indicate that recent price positioning favors the upper half of the Donchian range. Traders may prioritize bullish setups when this positioning aligns with higher highs, higher lows, and confirmed bullish price action. **Bearish Trading Opportunities** Look for histogram readings below zero, particularly when red coloring is present. These readings indicate that price is positioned in the lower half of its historical Donchian range. Traders may prioritize bearish setups when the histogram agrees with lower highs, lower lows, and bearish market structure. **Zero-Line Crossovers** A crossover above zero indicates that the smoothed price-position calculation has moved into the upper half of the Donchian range. A crossover below zero indicates a transition into the lower half. These changes may provide early directional clues, but should be evaluated alongside market structure and price confirmation. **Trend Continuation Analysis** Sustained positive histogram readings can support an existing bullish directional bias. Sustained negative readings can support an existing bearish directional bias. Values moving farther from zero suggest that the smoothed price-position measurement is moving toward one side of the Donchian range. **Pullback Analysis** During an uptrend, a declining positive histogram may indicate that price is moving back toward the middle of its range. During a downtrend, a rising negative histogram may indicate movement back toward the midpoint. Traders can monitor these changes for potential pullback and continuation setups. **Using Candle Colors** Matching candle colors provide an immediate view of the indicator's directional classifications. Use them as a visual filter rather than automatic entry signals. **Combining with Other Indicators** The Donchian Histogram can complement: - Fractal breakout analysis. - Market structure and support/resistance. - Opening Range Breakout strategies. - SuperTrend indicators. - Higher-timeframe directional filters. - Momentum confirmation tools. For best results, combine histogram readings with a complete trading plan that includes entry confirmation, trade invalidation, stop placement, and risk management.
Settings and Configuration
The [CT] Donchian Histogram w/Candle Colors includes three primary configurable inputs. **Donchian Timeframe (minutes)** Default: 240 This setting contributes to the calculated historical lookback period. The original script scales the lookback using the selected Donchian Timeframe and active chart timeframe, with a multiplier of seven under its main intraday calculation. For example, on a standard 5-minute chart using the default value of 240, the intended lookback calculation produces 336 chart bars. This input does not use TradingView's `request.security()` function. It adjusts the historical lookback rather than independently calculating a true higher-timeframe series. **Signal Lookback** Default: 2 Controls the Simple Moving Average smoothing period applied to the Donchian price-position calculation. Shorter values produce faster responses to changes in price positioning. Longer values produce smoother histogram readings. This input also serves as the numeric threshold used in the histogram's color-selection logic. **Color Price Bars to Match Histogram** Default: Enabled When enabled, candles on the main price chart automatically match the histogram colors. When disabled, the indicator leaves the chart's existing candle colors unchanged. **Histogram Color Interpretation** - Teal: Positive or zero reading above the signal threshold. - Lime: Positive reading below the signal threshold. - Red: Negative reading below the signal threshold. - Orange: Remaining threshold conditions. **Suggested Starting Configuration** For intraday trading: - Donchian Timeframe: 240. - Signal Lookback: 2. - Color Price Bars: Enabled. Traders can experiment with longer signal smoothing to reduce short-term fluctuations or shorter smoothing to increase responsiveness. The indicator's zero-line calculation remains the central reference for interpreting bullish and bearish positioning. **Calculation Note** The original code does not explicitly handle a zero-width Donchian range, where the highest high equals the lowest low. In that situation, the ratio calculation may be undefined until a valid price range is available.
This tool is designed to support a complete trading process with market context, defined risk, and clear invalidation. It is not a guarantee of future results.