
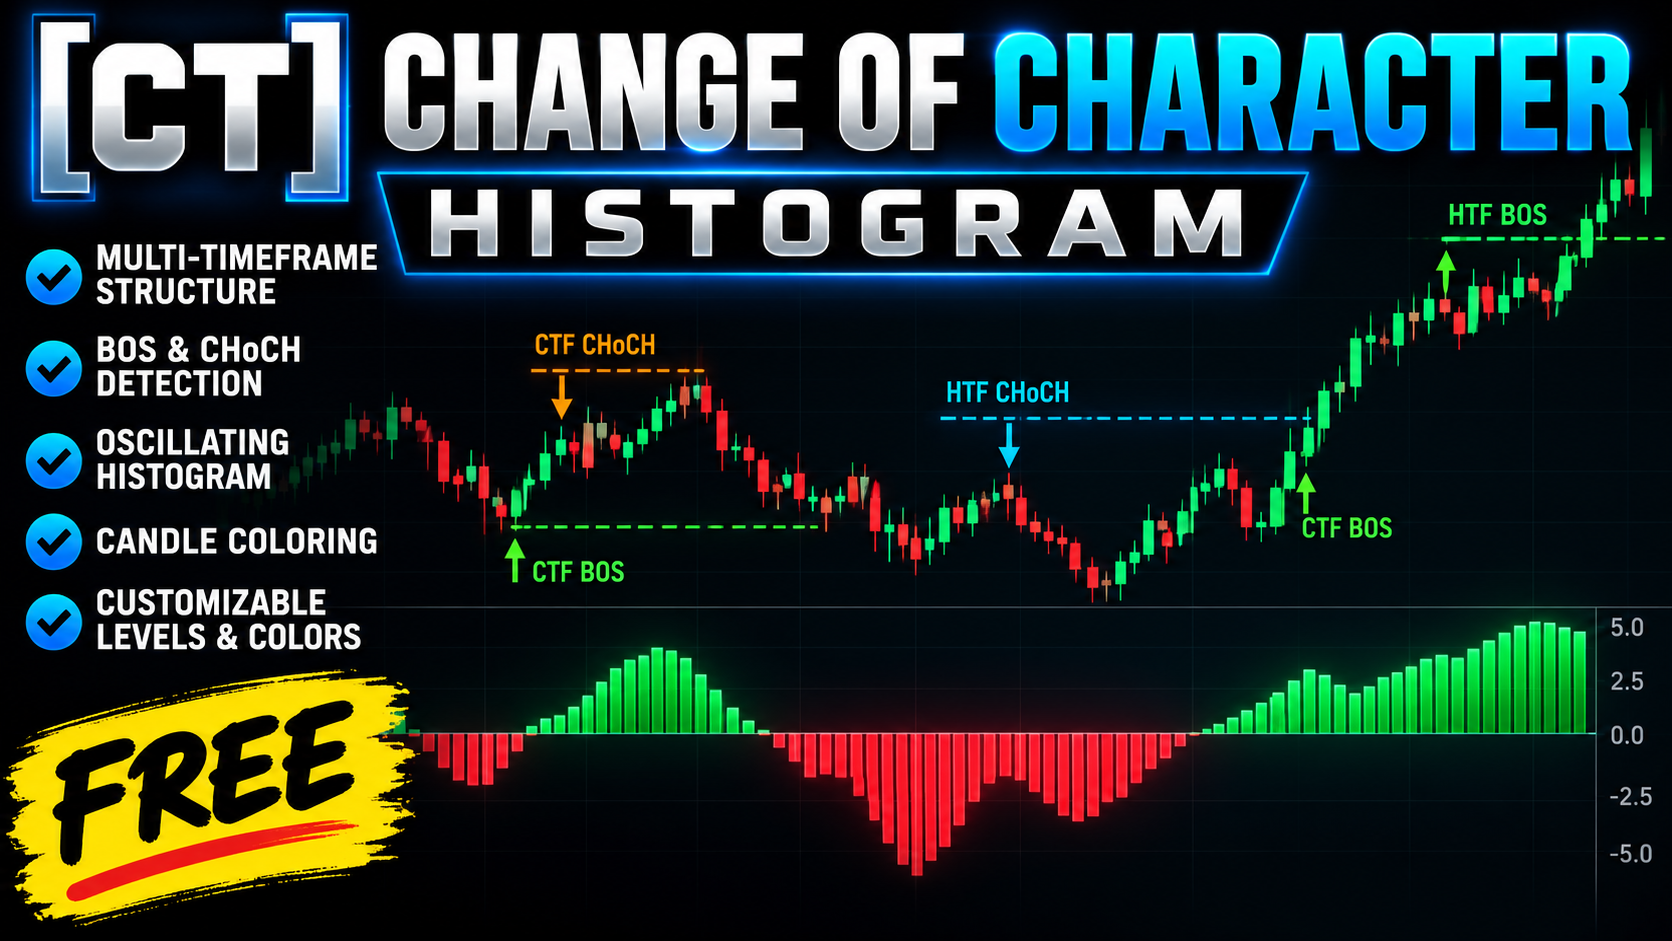
About [CT] Change of Character Histogram
The [CT] Change of Character Histogram is a free multi-timeframe market structure indicator designed to help traders identify changes in structural direction, recognize trend continuation, and monitor breakout-momentum activity. The indicator analyzes confirmed swing highs and lows to detect Breaks of Structure (BOS) and Changes of Character (CHoCH). It independently evaluates the chart timeframe (CTF) and a user-selected higher timeframe (HTF), allowing traders to examine the relationship between shorter-term and broader market structure. An oscillating histogram displays bullish and bearish structural direction while expanding and contracting according to accumulated breakout-momentum magnitude. Optional price-candle coloring provides additional visual confirmation. Traders can also display BOS and CHoCH price levels directly on the main chart, with independent CTF/HTF colors, line widths, labels, and adjustable wording offsets. The indicator is designed to simplify market-structure analysis and help traders identify potentially important directional changes without requiring multiple separate structure indicators.
What this indicator provides
- - **Multi-Timeframe BOS/CHoCH Detection** — Identifies structural continuation and directional changes on chart and higher timeframes.
- - **Oscillating Structure Histogram** — Visualizes bullish/bearish structural direction with variable-height momentum columns.
- - **Chart & HTF Trend Alignment** — Optional Both Agree mode highlights shared directional structure.
- - **Optional Candle Coloring** — Colors price candles using independently selected structural direction.
- - **Customizable Structure Levels** — Displays CTF and HTF BOS/CHoCH levels directly on the price chart.
- - **Eight Independent Level Colors** — Customize bullish and bearish BOS/CHoCH colors for each timeframe.
- - **Adjustable Label Positioning** — Control wording size and separate CTF/HTF horizontal offsets.
- - **Adjustable Pivot Sensitivity** — Fine-tune swing identification for different instruments and timeframes.
- - **Momentum Decay Control** — Adjust how rapidly breakout-momentum magnitude contracts.
- - **Free Traders Vibe Indicator** — Core market-structure analysis without requiring the premium ABS confirmation features.
How It Works
The indicator identifies pivot highs and lows using adjustable left/right pivot settings. When price breaks a previously confirmed swing level, the script determines whether the break represents structural continuation or a change in the established direction. **BOS (Break of Structure):** A break that continues the current structural direction or establishes the initial direction. **CHoCH (Change of Character):** A break in the opposite direction of the previously established structural trend, potentially indicating a directional shift. The histogram uses two calculations: **Direction:** Green represents bullish structure, and red represents bearish structure. Users can follow the chart timeframe, higher timeframe, or require both timeframes to agree. **Height:** The histogram expands and contracts using accumulated breakout-momentum magnitude derived from previous candle-body breaks, closing position, ATR-based range expansion, and relative volume when available. The momentum value gradually decays when candles do not produce qualifying breakouts. Because histogram height uses the absolute magnitude of breakout momentum, a growing green column does not necessarily mean bullish momentum is strengthening. The color represents structural direction, while the height represents momentum magnitude. Optional price-candle coloring follows the selected structure timeframe independently of the histogram. The indicator also draws confirmed CTF and HTF BOS/CHoCH levels on the price chart, using customizable colors, line widths, labels, and horizontal wording offsets. Higher-timeframe structure uses previously completed HTF candles.
Suggested Usage
The [CT] Change of Character Histogram is designed to support the Traders Vibe market-structure trading process by identifying directional bias, structural transitions, and breakout-momentum conditions. **Step 1 — Establish Market Direction** Use the histogram to determine whether the selected market structure is bullish or bearish. Green indicates bullish structure, while red indicates bearish structure. **Step 2 — Identify CHoCH Events** Monitor changes in histogram direction and optional CHoCH levels for potential changes in market character. A CHoCH provides an indication of structural change, not confirmation that a sustained reversal will occur. **Step 3 — Monitor BOS Continuation** After a directional change, look for subsequent BOS events that support continued movement in the established direction. **Step 4 — Evaluate Breakout Momentum** Observe whether histogram columns expand or contract. Changes in height reveal changes in accumulated breakout-momentum magnitude, providing additional context for the structural trend. **Step 5 — Confirm Multiple Timeframes** Use the Both Agree setting to display bullish or bearish histogram direction only when chart-timeframe and higher-timeframe structure align. **Step 6 — Identify Trading Areas** Enable BOS/CHoCH levels to identify previously broken structural prices that may become relevant during pullbacks, retests, or continuation attempts. For additional entry confirmation, traders can combine the indicator with price action, support/resistance, and other Traders Vibe momentum tools. The indicator is intended for market analysis and trade confirmation, not as an automatic buy-or-sell system.
Settings and Configuration
**Timeframes and Structure** - Higher Timeframe: 5 minutes by default. - Chart Pivot Left/Right: 3/3. - HTF Pivot Left/Right: 3/3. - Structure Break Confirmation: Close or Wick. The higher timeframe must be greater than the active chart timeframe. Smaller pivot values identify more frequent swings, while larger values focus on broader structure. **Histogram Settings** - Histogram Trend Source: Chart TF, Higher TF, or Both Agree. - Column Width: 3 by default. - Minimum Histogram Height: 0.50. - Maximum Momentum Height: 5.00. - Momentum Decay: 0.20. Momentum Decay determines how quickly accumulated breakout momentum contracts during candles without qualifying breakouts. It does not change structural direction. **Histogram and Candle Colors** Users can customize bullish, bearish, and neutral colors. Price-candle coloring is optional and can independently follow Chart TF, Higher TF, or Both Agree. **Structure Level Visibility** Independently display CTF BOS, CTF CHoCH, HTF BOS, and HTF CHoCH levels. Users can extend levels to the right and configure the maximum number of historical structure levels. **CTF and HTF Level Colors** Eight independent color settings are provided for bullish/bearish BOS and CHoCH levels across both timeframes. CTF and HTF line widths are independently adjustable. **Structure Labels** - Show or hide BOS/CHoCH wording. - Choose Tiny, Small, Normal, or Large text. - Adjust CTF wording horizontally. - Adjust HTF wording horizontally. **Recommended Starting Configuration** For a 1-minute trading chart, begin with a 5-minute HTF, 3/3 pivots, Close confirmation, and Higher TF histogram direction. Enable the CTF CHoCH and HTF CHoCH levels to study directional changes while keeping the chart relatively uncluttered. Note: The script's structure-level input allows up to 500, but the currently supplied indicator declaration specifies a 300-line and 300-label drawing limit. Increase those declaration values to 500 to support the full requested history.
This tool is designed to support a complete trading process with market context, defined risk, and clear invalidation. It is not a guarantee of future results.