
About [CT] Advanced CVD Histogram with Entry Signals
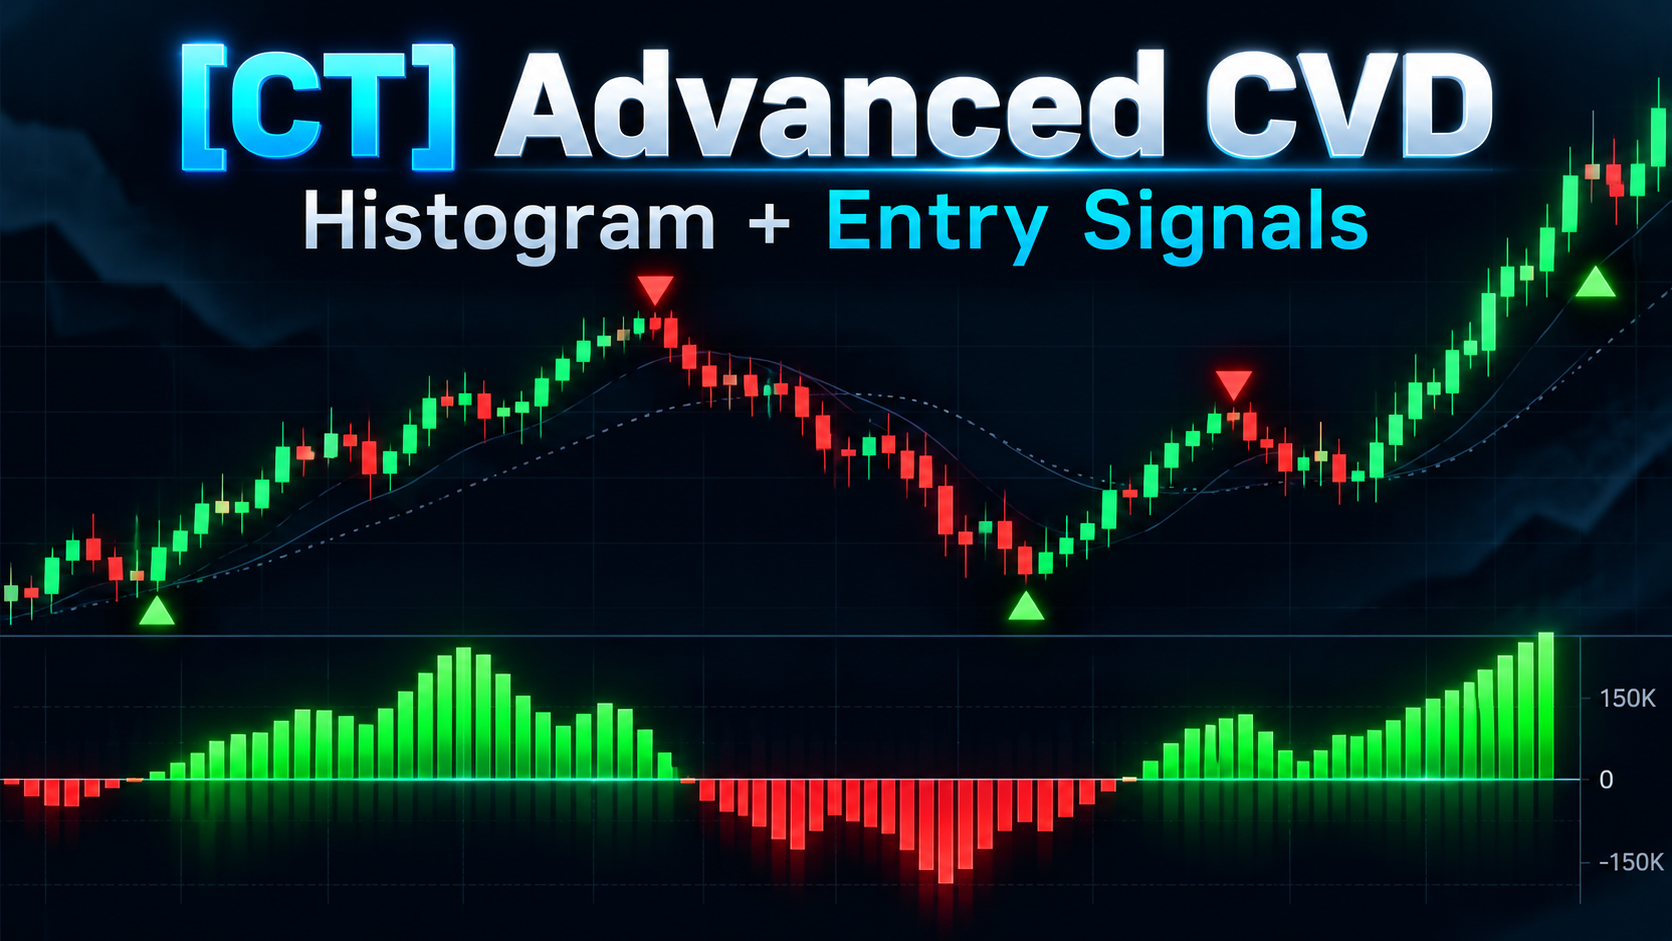
[CT] Advanced CVD Histogram with Entry Signals is a lower-panel volume-momentum indicator designed to help traders evaluate changes in estimated buying and selling pressure through normalized cumulative volume delta momentum. Rather than simply plotting raw cumulative volume delta, this indicator measures the momentum of smoothed CVD and then normalizes that momentum against its recent standard deviation. This helps traders identify when volume pressure is behaving in an unusually strong bullish or bearish way relative to recent market conditions. The indicator is designed to help solve an important trading problem: price can move higher or lower without clearly showing whether volume momentum is strengthening, weakening, or beginning to shift. This tool gives traders a way to visually monitor that momentum and determine whether current price movement is being supported by stronger positive or negative volume conditions. The indicator also includes automatic BUY and SELL entry signals, optional RSI filtering, optional price-candle coloring, and alert conditions. It can be used for momentum confirmation, reversal analysis, and trend continuation support when combined with market structure and price-action analysis.
What this indicator provides
- Normalized CVD Momentum Histogram
- Bullish and Bearish Entry Signals
- Price-Chart Signal Markers
- Optional RSI Filter
- Optional Candle Coloring
- First Threshold Cross Mode
- Every Qualifying Bar Mode
- Candle-Close Signal Confirmation
- Zero-Line Momentum Analysis
- Customizable Momentum Thresholds
How It Works
The indicator begins by estimating volume delta using candle direction. If a candle closes above its open, the candle’s volume is treated as positive. If a candle closes at or below its open, the candle’s volume is treated as negative. These values are accumulated into a running cumulative volume delta, or CVD. That cumulative delta is then smoothed using a simple moving average. The script measures the change in the smoothed CVD from one bar to the next, creating a CVD momentum reading. That momentum is then divided by its recent standard deviation over the selected lookback period. This produces the normalized CVD momentum histogram. Green histogram bars indicate positive normalized momentum. Red histogram bars indicate negative or nonpositive normalized momentum. The histogram is centered around a zero line, while upper and lower threshold levels help define when momentum is strong enough to qualify for potential entry conditions. A BUY signal appears when normalized CVD momentum rises above the positive threshold. A SELL signal appears when normalized CVD momentum falls below the negative threshold. By default, the script uses First Threshold Cross mode, so it marks the first candle where the full qualifying condition becomes true rather than repeating a signal on every qualifying bar. The optional RSI filter can be enabled to require bullish signals during oversold RSI conditions and bearish signals during overbought RSI conditions. The script also includes optional candle coloring so price candles can match the bullish or bearish histogram state. Important note: this is an estimated candle-direction-based delta model, not true bid/ask order-flow delta.
Suggested Usage
[CT] Advanced CVD Histogram with Entry Signals is best used as a confirmation tool inside the Traders Vibe trading process. Start by identifying direction with your market-structure tools, such as BOS, CHoCH, support and resistance, trend structure, or key zones. Once structure is identified, use the histogram to confirm whether bullish or bearish momentum is increasing or weakening. In bullish conditions, traders can look for the histogram to move above zero and then exceed the positive threshold, showing strengthening positive CVD momentum. In bearish conditions, traders can look for the histogram to move below zero and then exceed the negative threshold in magnitude, showing strengthening negative CVD momentum. The automatic entry triangles can help highlight qualifying momentum conditions, but they should not be treated as standalone trade entries. They are best used with price-action confirmation, structural context, and risk management. If the RSI filter is enabled, the indicator can also be used to help identify possible reversal conditions during oversold or overbought environments. Optional candle coloring can be turned on if you want the main chart to visually reflect the histogram’s bullish or bearish momentum state. This can be helpful for traders who want fast visual confirmation without constantly looking down at the lower panel.
Settings and Configuration
Recommended starting settings: - Lookback Period: 20 - Smoothing Period: 3 - Signal Threshold: 1.0 - Use RSI Filter: Off - RSI Period: 14 - RSI Oversold: 30 - RSI Overbought: 70 - Show Entry Signals: On - Show Signals on Price Chart: On - Show Signals in Histogram Panel: Off - Confirm Signals on Candle Close: On - Entry Signal Mode: First Threshold Cross - Color Price Candles: Off - Color Confirmed Candles Only: On Configuration notes: The Lookback Period controls how far back the script measures standard deviation for normalized momentum. Increasing it generally smooths the statistical baseline, while lowering it can make momentum appear more reactive. The Smoothing Period controls how much smoothing is applied to cumulative volume delta before momentum is measured. Lower values react faster but may be noisier. The Signal Threshold controls how strong normalized momentum must be before a signal qualifies. Lower thresholds create more signals. Higher thresholds create fewer but stricter signals. The RSI filter is optional and is disabled by default. When enabled, it changes the tool from a pure momentum-based signal model into a more reversal-oriented confirmation model. Price-candle coloring is also optional and can be enabled if you want the chart candles to match the histogram’s bullish or bearish color state. This indicator works best when used alongside market-structure analysis rather than as a standalone system.
This tool is designed to support a complete trading process with market context, defined risk, and clear invalidation. It is not a guarantee of future results.